Executive Summary
For retirees who are more concerned about running out of money in retirement than leaving a large inheritance behind, the optimal retirement asset allocation strategies shift from focusing on wealth maximization and owning as much in equities as you can tolerate (to provide the greatest return on average), to approaches that do a better job of preserving wealth in adverse scenarios (even if it costs excess upside when times are good).
This retirement approach of focusing on minimization to spending risks over maximization of wealth accumulation has led to a wide range of retirement asset allocation and product strategies, including the use of annuities with guarantees, bucket strategies with cash reserves, and most recently the “rising equity glidepath” approach where portfolios start out more conservative early in retirement and become progressive more exposed to equities over time as bonds are spent down in the early years.
The caveat of risk minimization strategies, though, remains the simple fact that most of the time, they turn out to be unnecessary, as the risky event never actually manifests. As a result, tools like Shiller CAPE that allow advisors to understand whether clients are more or less exposed to a potential decade of mediocre returns (which brings about the “sequence-of-return risk” in retirement) can be remarkably effective at predicting when it’s necessary to focus on risk minimization in the first place, and when wealth maximization may be the more prudent course.
In fact, as it turns out, market valuation measures like Shiller CAPE can actually be so predictive of the optimal asset allocation glidepath in retirement, that the best approach may not be to implement a rising equity glidepath or a static rebalanced portfolio at all, but instead to adjust equity exposure dynamically based on market valuation from year to year throughout retirement. While this kind of tactical asset allocation approach is not necessarily a very effective short-term market timing indicator, the results suggest nonetheless that it can help to minimize risk when necessary, take advantage of favorable market returns when available, and have some of the best of both worlds – albeit with the caveat that markets can still deviate materially in the short run from what valuation alone may imply regarding long-term returns!
Declining And Rising Equity Glidepaths Across Valuation Environments
In our original research on equity glidepaths in retirement, Wade Pfau and I tested a wide range of asset allocation strategies in retirement, from the “traditional” advice to decrease equity exposure as the retiree ages, to simply holding a static portfolio that is regularly rebalanced, to actually starting the portfolio more conservative and allowing equity exposure to rise along the retiree’s time horizon. And contrary to prevailing wisdom about taking equities off the table as a client ages throughout retirement, our results found that for those who wish to protect against the most adverse outcomes, owning a more conservative portfolio to start and allowing equities to drift higher in retirement can actually be a more effective approach. Retirees who adopted a conservative starting portfolio with a rising equity glidepath finished with less wealth on average (as most of the time, the sequence of returns in retirement are not actually disastrous and owning less in equities just results in less compounding wealth!), but nonetheless for those who were willing to trade off wealth maximization in most cases for risk minimization for the few times it matters, the rising equity glidepath showed a modest but persistent benefit by aiding the portfolio’s sustainability in the worst sequences.
Still, the fact that most of the time a retiree doesn’t have a terrible sequence of returns at the start of retirement, and therefore usually wouldn’t need a rising equity glidepath, raises the question of whether anything can be done to predict when bad sequences are likely to occur. After all, if you knew that there was less danger of getting a decade of mediocre returns in the first place, you would be less likely to need to implement a rising equity glidepath to protect against such a bad sequence.
And is it turns out, getting a decade-long unfavorable sequence of returns is not entirely random after all; such sequences can be at least partially predicted by long-term valuation measures like Shiller CAPE, which are a poor predictor of short-term performance (and therefore a mediocre market timing indicator) but a remarkably powerful predictor of long-term performance. Which means there is the potential that if Shiller CAPE can predict the danger of an extended sequence of bad market returns, it can predict which type of asset allocation glidepath is most likely to be necessary to navigate retirement itself.
To test this perspective, we decided to replicate a version of our prior glidepath research, but instead of using Monte Carlo analysis built around a wide range of possible return assumptions, we tested the results against actual historical market returns, where we can also examine the potential role of the market’s starting valuation at the beginning of retirement. We’ve already seen that market valuation can predict the safe withdrawal rate in retirement, but can the optimal retirement glidepath itself also be predicted by market valuation at the onset of retirement?
The Impact Of Market Valuation On The Optimal Asset Allocation Glidepath In Retirement
To analyze the situation, market valuation at the start of retirement was broken into three groups: markets that were “overvalued” (where Shiller CAPE was above 4/3rds of the historical average); “undervalued” (where Shiller CAPE was below 2/3rds of the historical average); and “fairly valued” (where Shiller CAPE fell between the 2/3rds and 4/3rds thresholds, which corresponded to a Shiller CAPE of about 11 and 21, respectively). These 2/3rds and 4/3rds thresholds are based on investing rules first developed by Graham and Dodd almost 75 years ago in their book on Security Analysis, and were chosen specifically because their methodology predates adoption of Shiller CAPE itself, reducing the risk of look-back bias.
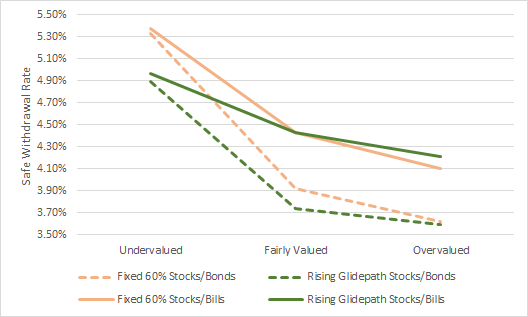
Accordingly, the chart below shows the safe withdrawal rate that would have worked depending on whether markets were overvalued, fairly valued, or undervalued at the start of retirement, segmented by whether the portfolio uses a combination of stocks and bonds (dotted lines), versus using stocks and Treasury Bills instead (solid lines), and whether the equity exposure is based on a fixed 60% allocation (yellow lines) or a portfolio that adopts a(n accelerated) rising equity glidepath starting at 30% in equities and increasing by 2%/year for 15 years (leveling off at the same 60% equity exposure for the second half of retirement) (green lines). (Michael’s Note: In the results based on historical data, a full 30-year rising equity glidepath was not an improvement over a static portfolio, suggesting that historically mean reversion has been powerful enough that waiting all 30 years to execute the glidepath is just “too slow”; by contrast, 15-year rising equity glidepaths that align better to typical long-term mean reversion appeared to yield far more favorable outcomes.)

As the results reveal, the optimal glidepath really does vary depending on the starting valuation environment of the markets. When markets are overvalued, the rising equity glidepath shows a slight improvement over a static 60% equity portfolio, but when markets are fairly valued the strategies are equivalent, and when undervalued the static 60% equity portfolio is clearly superior.
Notably, the results also show that in overvalued environments, using stocks and Treasury Bills is actually superior to using a more traditional stock/bond portfolio – in essence, the retiree is not paid to take on bond/interest rate risk in environments where stock risk is also elevated, and it’s better to utilize Treasury Bills that can act as ballast against the market volatility! – while when stocks are favorably valued, using a stock/bond portfolio yields an equivalent safe withdrawal rate to using stocks and Treasury Bills.
Valuation-Based Tactical Asset Allocation In Retirement
Given that the optimal asset allocation glidepath throughout retirement is sensitive to the starting market valuation at the beginning of retirement, the results also raise the question of whether tying ongoing asset allocation changes throughout retirement to market valuation may also lead to an improvement in safe withdrawal rates, as has been suggested in some prior research.
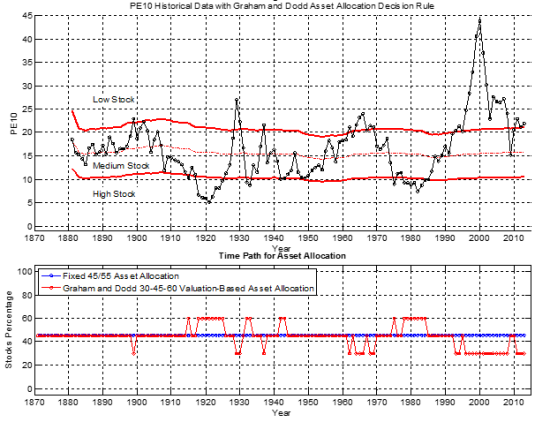
Accordingly, a “valuation-based” tactical asset allocation approach was created, where the portfolio starts out at a “neutral” 45% in equity exposure, increasing to 60% in equities when markets are “cheap” and undervalued, decreasing to only 30% when markets are “expensive” and overvalued, and remaining at the neutral 45% in equities when markets are fairly valued in the middle (where the thresholds again are defined using the Graham and Dodd 2/3rds and 4/3rds thresholds). The chart below shows where these thresholds would have fallen relative to Shiller CAPE (P/E10) historically, and the asset allocation changes that would have occurred over the decades.

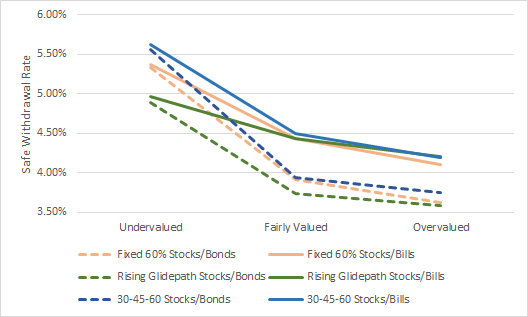
Given this framework, we can then test how these 30%-45%-60% valuation-based tactical asset allocation strategies would have performed compared to either rising equity glidepaths or static portfolios at varying starting valuations. And as the results reveal, the valuation-based portfolios are actually a small but noticeable improvement over either, yielding comparable results when markets are overvalued but superior results when markets undervalued (and again, with stocks/bills valuation-based strategies outperforming stocks/bonds)!

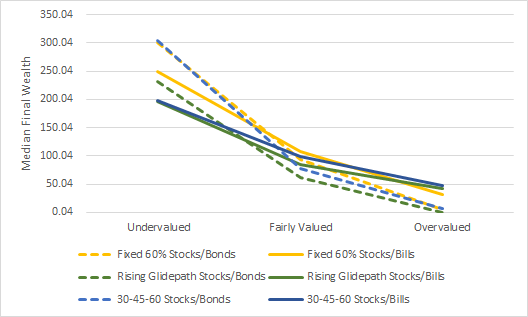
Notwithstanding the improvements on the basis of safe withdrawal rates, though, it’s notable that when analyzed based on median wealth at a 4% safe withdrawal rate (i.e., how much wealth was left over 50% of the time when the safe withdrawal rate was set to an arbitrary 4% starting percentage), portfolios that have similar safe withdrawal rates (prior chart) can produce significantly more in wealth accumulation (chart below); thus, for instance, while stocks/bonds portfolios have similar safe withdrawal rates to stocks/bills in favorable valuation environments, the stock/bond portfolios produce far more wealth even while producing similar worst-case scenarios. On the other hand, when equities start out overvalued at the beginning of retirement – where the worst-case scenarios can be really bad – stocks/bills portfolios still produce greater safe withdrawal rates and greater median wealth than using bonds, even though the yield on Treasury Bills is so much lower!

Overall, though, the conclusions remain that whether based on safe withdrawal rates as a measure of minimizing risk, or median wealth as a measure of maximizing wealth accumulation, the valuation-based tactical portfolios (that start at 45% in equities but fluctuate between 30% and 60%) appear to do slightly better than either a fixed 60% equity exposure or a rising equity glidepath. When market valuation starts out unfavorable, the valuation-based portfolio starts out similar to a rising equity glidepath, but is able to more quickly adjust to higher equity allocations if valuation becomes favorable. By contrast, when valuations start out favorable, the valuation-based portfolio starts out similar to a fixed 60% equity portfolio, but becomes more conservative when necessary to avoid damaging drawdowns.
Notably, this still doesn’t necessarily mean that the valuation-based approach will be especially good as a short-term timing indicator – these results are compounded over 30 years, not based on annual or quarterly reporting compared to a benchmark, and are likely driven by the fact that they minimize bear markets only by missing part of the final stage bull market that precedes them, and similarly participate in bull markets by investing amidst the tail end of a bear market (and potentially bearing the final stages of volatility along the way). In addition, the results do show that valuation-based tactical portfolios still vary as to whether they should be implemented with bonds or Treasury Bills; valuation-based portfolios may still be better using stocks/bills when valuations are high, and stocks/bonds when valuations are low.
Nonetheless, the bottom line appears to be that while rising equity glidepaths are best in certain (overvalued) environments and that fixed portfolios are better in other (undervalued or fairly valued) ones, that simply allowing equity exposure to shift from year to year tactically based on the market valuations as they change dynamically throughout retirement may be most capable of capturing the best of both worlds, at least for the investor focused on long-term results that is less concerned about short-term performance deviations. Given today's valuation environment, where Shiller P/E10 really is at elevated levels, this would suggest that conservatism is still merited for today's retirees, either by owning less equities with an expected rising equity glidepath, or at least underweighting them on a valuation basis until the valuation moves into the "fairly valued" zone.
For those interested in Wade's perspective on this research, he has a post up on his blog about sequence of return risk and how glidepaths and valuation-based asset allocation manage it, and you can see the results of our latest analysis in full depth, including the impact of further valuation-based adjustments to rising and declining glidepaths, and the impact of portfolios that are “unbounded” and can stray even further than the 30% and 60% equity thresholds, by viewing the full copy of the draft research of the study “Retirement Risk, Rising Equity Glidepaths, and Valuation-Based Asset Allocation” on SSRN.
As always, we welcome your thoughts, criticism (constructive, please!) and other feedback below in the comments below!


From the article it appears that the bond portfolio consists of 10 yr Treasuries. Is that correct?
Wesmouch,
Yes, the bond allocation is based on 10-year Treasury yields (with a proxy for 10-year Treasury yields prior to 1953), which we then adjusted to convert from yields into total return by calculating what the price change would have been given the change in yields from one year to the next. Full formula and details are explained in the methodology section of the paper posted to SSRN.
– Michael
This is MORE great work from you and Wade. I’ve started wading through the details and am very excited to do so. I gotta say I love Wade and David Blanchett’s work too! Thanks for the White Paper! Here is my weekend reading.
Thanks Bruce! I hope it’s helpful food for thought! 🙂
– Michael
You’re one of the first advisors I’ve read who recognizes the need to be more conservative early in retirement rather than late in life. Because of sequencing risk, the time of greatest concern for retirees should be early retirement for this simple reason… If an 85 year old losses 20+% of his portfolio value, he may have a 5 year problem on his hand. On the other hand, if a 65 year old loses 20+% of his portfolio, he likely has a 25 year problem on his hand, assuming he & his wife live to age 90.
Have you researched what might be the best declining-equities glidepath for a younger investor as they attain a 30/70 equities/bond portfolio by age 65? The issue of allocation is likely critical as they accumulate their portfolio wealth. Perhaps I have missed earlier discussions posed by you about pre-retirement equity glidepaths.
UpNorth,
We haven’t done a full study yet on what the pre-retirement glidepath looks like to get you down to that “approximately 30%” in equities at retirement. I anticipate we’ll see a glidepath that takes equity exposure down incrementally in the years leading up to retirement, but we haven’t done the study yet to try to figure out what exact pacing is best – e.g., whether you glide down in the 5 years before retirement, or 10, or some other pace. Stay tuned! 🙂
– Michael
Huh? I thought I posted feedback yesterday and it disappeared??? Anyhoo, here is what I had in mind…
1. Terrific research, which intersects with some analysis I did myself in the past few weeks. Thank you, Wade and Michael.
2. It would be great to expand such research by comparing several well-known valuation metrics. I don’t find PE10 to be that good, actually. PE25 seems better, as well as Tobin’s q.
3. Nice to see that the usual valuation metric mistake (hindsight knowledge when computing the mean to compare to) was avoided. I’m afraid Tobin’s q valuation metric is often skewed in this respect.
4. Maybe the criterion for switching to more or less equity should be based on a valuation-based equity premium more than just equity valuations. Bonds can be overvalued and undervalued too…
Thanks for the paper and related blog posts.
I’m wondering if you might consider doing some follow-up research concerning valuation-based asset allocation during the accumulation phase.
It seems that the general consensus is to use a declining-equity glidepath based on age or years until retirement, but I’m wondering if there might be a better way that takes valuation into account.
I think it’s a different question from the distribution phase since withdrawals are not being made.
Similarly, I would have the same question about a portfolio which is neither accumulating nor distributing – I call it a “Let It Ride” portfolio. Does a valuation-based asset allocation make sense in this scenario?
Thanks again for your work.
Linden
Michael, I sent you an email a few weeks back concerning the Schiller CAPE and I really wish you’d stop encouraging advisors to use this metric as a predictor of future long term equity market returns. Yes this has been an extremely useful tool in the past but the events of the latest recession have rendered this metric unusable for nearly the next decade. This isn’t the place to discuss the details in depth, I wish you’d write an article about this using the information I provided you. Here’s the summary for your readers:
1) Schiller CAPE uses 10 year historical reported earnings in its denominator. Reported earnings and actual operating earnings never varied by more than 17% before the year 2000. In 2008-2009 reported earnings vs operating earnings varied by greater than 80%. To keep this short, this causes the CAPE to use earnings that were way smaller than is reasonable and actually reflective of economic conditions. If the denominator is too small, then it makes the ratio appear to be larger, thus giving off a false signal of low future equity market returns.
2) Schiller CAPE uses 10 year historical reported earnings in its denominator. These earnings include any company that was in the S&P during that year. So we have a large number of firms that went bankrupt in the last 10 years whose earnings are still being reflected in the denominator of the CAPE ratio. Again, this causes the CAPE ratio to be larger than is actually representative of S&P 500 companies and gives off a false signal of low future equity market returns.
The Schiller CAPE is a worthless tool right now and it’s important that we educate advisors on why and the alternatives.