Executive Summary
As a guaranteed income stream that cannot otherwise be liquidated or reinvested, most retirees don’t think of their Social Security benefits as an asset. Nonetheless, its value actually can be calculated, given known payments and reasonable assumptions regarding interest/growth rates and life expectancy.
And in fact, the payments are significant enough that it would take several hundred thousand dollars just to replicate the average Social Security retirement benefit for an average life expectancy. For many retirees, that would be a material portion of their total net worth, it not the largest asset on their balance sheet!
Yet unlike most other assets, the value of Social Security is uniquely impacted by its assumptions… where unlike traditional assets, the value is actually higher when inflation rises, and is greater when interest rates are low. As a result, viewing Social Security as an asset actually reveals that it is a highly desirable asset for a retiree, uniquely capable of hedging many risks in retirement that traditional portfolios cannot… and making it all the more appealing to preserve the Social Security “asset” for its diversification by delaying benefits as long as possible!
Estimating The Lump Sum Value Of Social Security
Social Security is a guaranteed income stream available at retirement for those who qualify. Of course, any stream of income has an economic value to it; however, because Social Security is available only as a guaranteed income stream, with specified payments based on wages earned and a fixed starting date that can only be adjusted forwards or back by a couple of years, most people think of Social Security separately from the rest of their (other) assets. A portfolio is a portfolio, and guaranteed income is guaranteed income, and never the twain shall meet.
Nonetheless, the availability of Social Security is of material value to most retirees, and decisions about the timing of when and how to use Social Security can impact the needs for drawing on other assets for retirement income. And in point of fact, it’s actually relatively straightforward to estimate what the approximate value of Social Security would be as an asset on the balance sheet.
After all, Social Security’s expected payments have an anticipated time horizon – the retiree’s life expectancy – and as a payment backed by the Federal government, has approximately comparable risk to any other government bond. And once you’ve determined the payment stream, a time horizon, and a growth/discount rate, you can calculate a “present value” of the series of cash flows as though it were a lump sum asset.
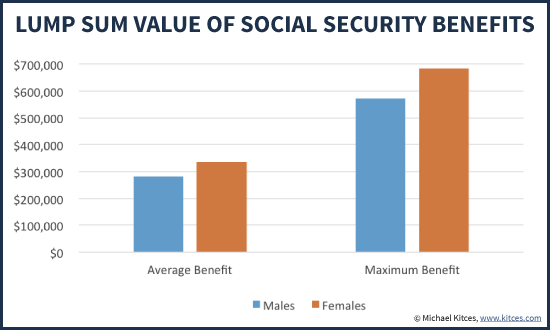
Accordingly, given an average Social Security retirement benefit of $1,294/month (in 2014), a 10-year Treasury rate hovering somewhere around 2% (at the time of this writing), assumed inflation of 3%, and a life expectancy (according to Social Security’s own 2010 Period Life Table) for someone who’s already reached age 66 (full retirement age for today’s retirees) of approximately 17 years for a male and 20 years for a female, the average “lump sum” value of Social Security is about $280,000 for males and $335,000 for females. At a maximum Social Security benefit of $2,642/month (for those who maxxed out the Social Security wage base for 35 years), the value of Social Security amounts to about $572,000 for men and $683,000 for women!
Notably, to the extent that inflation is higher than 3%, the (nominal) value of Social Security is even higher, since its future payments are all inflation adjustment. In addition, since a worker’s Social Security earnings record fuels not only his/her own benefit but also spousal payments, the lump sum value of Social Security can be as much as 50% higher for some members of a couple. Similarly, to the extent that a worker’s benefit also supports a spouse’s survivor benefit, the estimated value would be approximately 15%-30% higher, given that the joint life expectancy of a couple is longer than either males or females individually. And notably, the value of Social Security would tend to be higher for financial planning clients as well, as their affluence would tend to give them greater life expectancy than the average of the whole general population included in the Social Security period life tables.
The Impact Of Delaying Social Security On Its Lump Sum Value
While Social Security’s lump sum value can be calculated based on the full retirement benefit, the reality is that Social Security doesn’t have to be taken at that full retirement age. It can be started early at a reduced value, or delayed later for a greater payment.
The opportunity to delay is often characterized as a “return” for delaying; after all, for each year that benefits are delayed past full retirement age, there is an 8% “delayed retirement credit” applied to increase benefits that are started later. For someone whose full retirement age was 66, waiting until age 70 results in a 4 x 8% = 32% benefit increase.
However, the caveat of delaying benefits is that while the payments will be higher, fewer are expected to be received, since the waiting retiree will be 4 years older by then and have a shorter life expectancy from that point forward. Thus, while the average benefit of $1,294/month would grow to $1,708/month by waiting until age 70 (and would actually be about $1,922/month in nominal dollars at that time, as four years’ worth of inflation adjustments accumulate as well), the payments would only be expected to last for about 14 years for a male and 16 years for a female at that point. When the value of Social Security is adjusted for the higher payments but shorter time period, and the “time value of money” for waiting four years, the lump sum value is only about $312,000 for males and $360,000 for females, a relatively modest increase of about 11% and 8%, respectively, from the benefits at full retirement age.
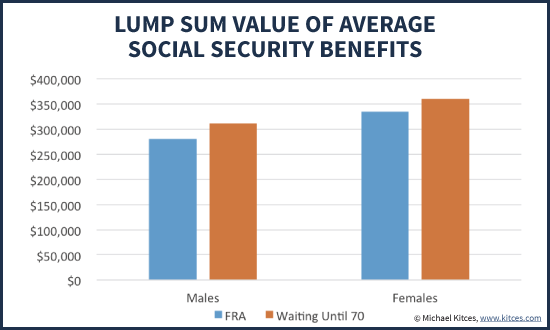
While this does still reflect an increase in the value of Social Security for delaying 4 years, it’s nowhere near a 32% increase in the asset value! And in reality, these differences are actually driven primarily by the fact that interest rates are so low, which creates a “bias” in favor of delaying Social Security (as it implicitly assumes the funds weren’t going to grow very much, anyway). In a more “normal” interest rate environment, where a government bond yields 6% instead, the value of Social Security at full retirement age versus delaying until age 70 is shown below.
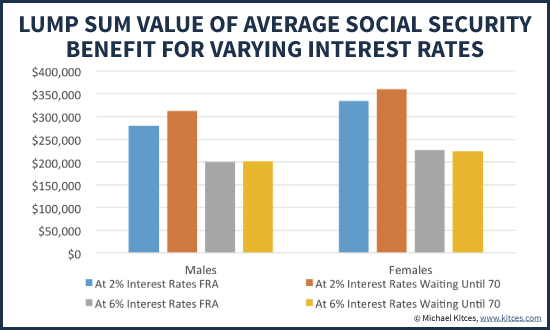
As the chart reveals, when interest rate assumptions are higher, the difference between taking benefits at full retirement age versus delaying until age 70 disappears almost entirely; the benefits are lower, and nearly identical. In point of fact, this is not just a coincidence; in reality, the whole point of assigning delayed retirement credits for those who wait on Social Security was not actually to enrich them, but simply to ensure the benefits would be “actuarially equivalent” regardless of whether benefits were taken earlier or later. It is only in today’s unusually low interest rate environment that the system tilts further in favor of delaying (and in turn is tilted further in favor of delaying for those who have benefited the most from improvements in life expectancy over the past several decades).
Coordinating The Value Of Social Security With Other Retirement Assets
Notably, the factors that drive the value of Social Security also have an impact on the other assets in the retirement portfolio. As shown earlier, at higher interest rates, the asset value of Social Security is actually lower (it’s not worth as much because it wouldn’t require as much in assets to produce the same stream of payments at higher growth rates); however, when returns are higher, the value of the rest of the retirement portfolio may be greater! In other words, Social Security provides a unique form of asset to hedge against the rest of the portfolio, because it’s an asset whose value increases as returns decrease!
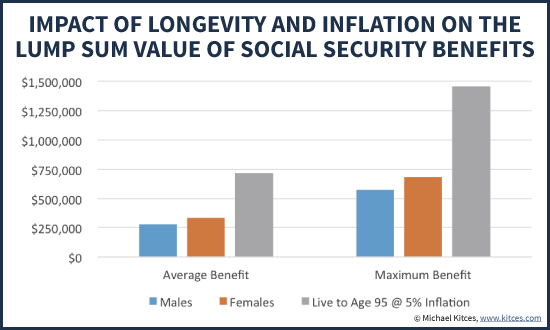
Similarly, while the value of Social Security has been calculated here based on average life expectancy and average inflation assumptions, the reality is that the value of Social Security will increase further for those who live beyond life expectancy, and will rise substantially if inflation turns out to be higher (since the payments are inflation-adjusted). For instance, if you live to age 95 and inflation turns out to be 5% instead of 3%, the value of an “average” Social Security benefit is actually a whopping $717,000 (and the maximum Social Security benefit is worth $1.46M!)!
Accordingly, then, when viewed from the balance sheet perspective, Social Security is not only a highly valuable asset overall, but one with very unique investment characteristics; unlike most other assets, its value rises in low-return environments, and is further enhanced by unexpected inflation. In addition, Social Security’s asset value naturally rises the longer you live, effectively providing a self-renewing asset that cannot be outlived (unlike the other retirement assets on the personal balance sheet!). In other words, one of the primary reasons to delay Social Security and spend other assets first is that the Social Security asset is the one best hedged to the risks that damage most retirements!
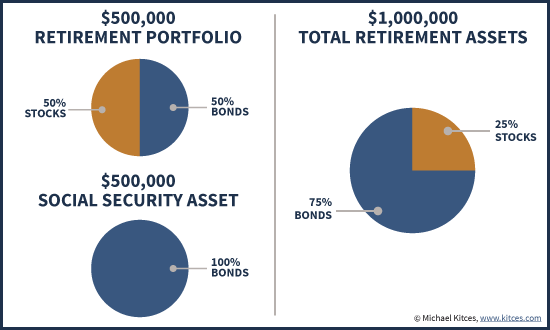
One notable caveat, though, is that the inclusion of Social Security on the personal balance sheet can actually lead to a materially “distorted” asset allocation, given that most would characterize Social Security as the asset-class equivalent of a government bond (or more accurately a TIPS bond given its inflation characteristics). After all, for most households that enter retirement with relatively modest retirement savings, an asset worth about $300,000 (for the average benefit) might be equivalent to the size of their retirement portfolio! A more affluent household that saves $500,000 for retirement – and has higher Social Security benefits also worth about $500,000 – may still find Social Security comprising about 50% of the total retirement assets. Yet if this household has $1,000,000 of total retirement assets, including a “balanced” 50/50 portfolio and a Social Security “bond” asset, then their true asset allocation is not 50/50, but 25/75!
Unfortunately, though, the fact that the Social Security “asset” biases the household balance sheet towards bond holdings is difficult to fix. After all, given that Social Security isn’t actually a liquid asset to be invested/allocated – or even seen as an account balance – getting to a 50/50 total mix would actually require putting 100% of retirement portfolios into equities! While this may be justified from a total household net worth basis, it would clearly be difficult to implement in practice, where clients may fixate on the equity-only portfolio and its volatility, and not necessarily recognize the role that the Social Security “bond” asset is playing to diversify it!
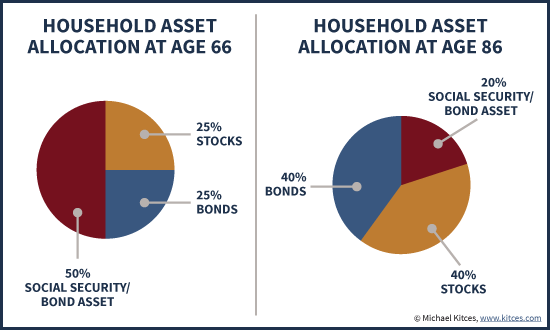
Ironically, though, as most retirees tend to rely on Social Security payments first (at least once they begin) and allow the portfolio to grow to the extent possible, the distortion of the household balance sheet towards a bond-heavy allocation actually resolves itself over time. As the years go by, the remaining value of the Social Security asset depletes (as it self-liquidates with payments), while the retirement portfolio tends to grow (especially in the first half of retirement when withdrawals are still modest); accordingly, the equity allocation of the household balance sheet actually glides higher on its own throughout retirement (as the equities in the portfolio comprise a larger percentage of total wealth) even if the portfolio itself remains 50/50 in stocks and bonds.
The bottom line, though, is simply to recognize that while it may not be a “liquid” asset or one that is naturally valued, Social Security is actually a very material retirement asset for most, and one with very unique investment characteristics that form a natural hedge for the rest of a retiree’s portfolio. Accordingly, while it may be difficult to actually adjust a household’s overall asset allocation around the bond-like Social Security asset, spending and liquidation decisions – including when to tap Social Security versus other portfolio assets – should be done in recognition of the fact that the Social Security asset may actually be better hedged than a traditional portfolio against the risks that endanger a retirement!
So what do you think? Have you ever included the present value of Social Security benefits as an asset on the client’s balance sheet? Would doing so make it easier to have the conversation about when/whether it’s best to delay Social Security benefits? Does this provide you with a different perspective on how to think about the value of Social Security?
Michael, this is very good stuff. I’ve had similar conversations with clients and advisors about the concepts you’ve covered here. You’re absolutely correct, it’s a tough conversation to have – getting to the understanding that the investment portfolio is always tilted more toward a conservative, high-“bond” holding when Social Security is in the mix. I might add that it’s a similar situation when looking at traditional pensions, although the present value of these would be valued differently from Social Security, and the pension is becoming a rare beast.
Excellent article – thank you!
Jim, what would make the pension NPV value calculation different than the SS calculation?
Perhaps a slightly different discount rate? (Corporate bond vs Gov’t bond, or even conservative diversified portfolio?)
– Michael
… Plus significantly lower assumptions for delay increases, as well as(for many if not most) no inflation adjustment.
Traditional pensions are the exact same. Only difference is if they are COLA’ed or not.
Similar, but not the exact same – as you point out there is the question of COLA difference for starters. And as I mentioned elsewhere there is a dramatic difference in delay factors as well.
In addition, pensions don’t get the preferential tax treatment that SS benefits do (SS could be tax free), and SS benefits provide a survivor benefit with no reduction to the original insured’s monthly payment (as long as it’s larger than the surviving spouse’s own benefit). Same goes for a spousal benefit – up to a 50% “bump” with no reduction to the original beneficiary’s benefit (and we won’t go down the rabbit hole of ex-spouse benefits and childrens’ benefits). As Michael points out, you’d likely use a different discount rate as well.
All in all there are quite a few differences between the calculation of the present value of SS benefits and traditional pensions.
Okay I did mention the difference in tax, slightly odd second to die/first to die aspect, etc.
But the calculation is the same and the discount rate should be the exact same. They’re both fixed income based annuity systems that can be approximated by the annuity marketplace. Technically speaking you could argue that pension amounts higher than PBGC limit have the ability to be adjusted in bankruptcy that those portions have higher default risk (and therefore a different payout assumption), but that is just splitting hairs.
NPV calculations, IRR, etc. are all the incorrect way to value a pension. The better way is to use competitive values in the annuity market to arrive at a value. To not use that first and foremost is to claim that a stock price (and market cap) is not a good price to arrive at the value of a company.
You use the word guaranteed 5 times. It isn’t guaranteed – see Flemming V Nestor. Benefit levels were significantly reduced on near-term retirees in 1977, and in 2033 there is a projected reduction of 20+ percent.
You don’t mention 2033 once, nor the difference between payable benefits and scheduled benefits. Someone who is 67 today expects to be alive in 2033. Mind you CBO’s projections I think are 2029 now. No one knows how that plays out.
I think your analysis should factor in taxes on Social Security benefits because outside income triggers some of the highest tax rates in the IRS code.
“In other words, one of the primary reasons to delay Social Security and spend other assets first is that the Social Security asset is the one best hedged to the risks that damage most retirements!”
You are urging people to reduce diversification within their income streams to depend upon a single stream that is projected to be deficient. That is irresponsible.
Excellent write up Michael (as usual!). Take a look at “Social Security Strategies – How to Optimize Retirement Benefits” by William Reichenstein. It is a similar analysis that seeks the NPV but weighs that against the risk of running out of money (using monte carlo). Personally no, I don’t include this as an asset on the balance sheet. Too many people would see a $300k asset and get lulled into a false sense of security… or should we say social security. 😉
Thanks for this post Michael. This is a conversation that I regularly bring up with my students, but haven’t taken the time to break down like this.
Advisors could consider displaying the SS asset as part of a household “withdrawal base”…similar to those seen on annuity contracts, making a clear distinction between the withdrawal base and liquid assets. This would also present the opportunity to discuss the overall allocation of the withdrawal base, highlighting the skew towards fixed income style assets, how that could potentially impact household cash flow in retirement, etc.
One place where there is often causes conflict of interest is with financial advisors with AUM fees (many of them), because retirees will lower the portfolio value that the advisor is managing and getting paid off of. (either dip into principle or at least lower growth). Have heard multiple advisors tell this to individuals to take social security at 62 and these people were in very good health (as that is one factor that make taking social security earlier more wise if they are in bad health and not likely to live to at least 80). Would that be a fiduciary breach Michael in your estimation if the adviser didn’t mention that they will (or very likely can… especially in the short run) personally benefit the earlier you take social security?
A little confused by the assumptions and the following:
“As shown earlier, at higher interest rates, the asset value of Social Security is actually lower (it’s not worth as much because it wouldn’t require as much in assets to produce the same stream of payments at higher growth rates); however, when returns are higher, the value of the rest of the retirement portfolio may be greater! In other words, Social Security provides a unique form of asset to hedge against the rest of the portfolio, because it’s an asset whose value increases as returns decrease!”
If nominal rates of return are Nominal = Inflation + Real Return + Term Premium + Credit Premium, etc. then how can increasing inflation increase the value of the asset? This will increase the nominal yield (and increase your discount rate) thus decreasing the value of the asset. I understand that you get in an increase in payments due to an inflation adjustment but that gets offset by a higher nominal rate that you should be using to discount the CF.
Also how is SS different from any other asset? You mention, “Social Security provides a unique form of asset to hedge against the rest of the portfolio, because it’s an asset whose value increases as returns decrease!” The same thing happens with all assets prices and is/has happened in the equity and fixed income markets of late. When rates of return decrease asset values inflate.
Also confused as to when returns are higher the value of the rest of the retirement portfolio will be greater? If we agree that the value of any asset (stocks, bonds, real estate, commodities) is the PV of future cash flows then how can a higher return equate to higher asset values and thus a higher portfolio value (similar to the logic mentioned above)? All this to say is that while SS provides an inflation hedge, I think its value (in PV terms) is somewhat correlated with the value of the portfolio and the direction of the rates of return.
Yes, and I also include their pension as a fixed investment, so they can take more risk and put more into equities.
Michael, your two recent pieces on Social Security benefits are outstanding.
Considering these benefits part of one’s asset allocation is problematic at best. They aren’t liquid or transferable and have no market value. They have no market correlation, so where would they even fit on the efficient frontier? They would probably best be considered an enhancement to one’s risk-free rate of return, which would raise the left end of the capital market line and provide a higher risk-adjusted portfolio return.
Yet, they are a valuable resource that must be included as a household resource on the budget sheet. For most households, it will be the most important resource. I think you argue both perspectives quite well.
Nice work!
I prefer using the anticipated SS and pension benefits to adjust my level of portfolio risk tolerance by thinking of the equivalent delayed annuity price of the anticipated SS and pension benefits. That is, what would an annuity cost, starting at 62 or 66.5 or 70 years of age to obtain the same monthly benefit as the SS or pension benefit in its first year. This is used to calculate an ‘equivalent’ net worth at the time of starting retirement; do the same for any pension benefits. From this, you can form a basis for the level of risk tolerance of your retirement portfolio that can be distributed between equities and bonds. Take your preferred risk value for equities and apply it to your total equivalent net worth and apply the result to the value of your invest-able portfolio to determine the percentage of equity investments in the portfolio. Doing it this way will give you a higher equity portion in your portfolio than you otherwise would have had for a ‘typical’ retirement portfolio (the old 60/40 or 50/50 bond/equity split). For me, this calculation method allowed me to be comfortable with a 70/30 equity/bond split as I near early retirement (at 58). In any case, I would not go beyond an 80/20 split.
A cash flow analysis for all the retirement years would then be used to validate the above.
^That is because that is the correct way to calculate it.
But you need use CPI inflation adjusted annuities to do it (and then in theory you should give SSI a little boost because of it’s preferential tax treatment).
Typically you’re looking at something like ~4.2% + inflation SPIA payout around 65. 100/4.2 = 23.8 times. 23.8*$24,000 a year is $571,000.
Age 66 is probably about ~4.35-4.4% on the market so ~22.7 times. for that.
That is what the market values an inflation adjusted income stream at which is what SSI is.
Thanks Anonymous, and concur with the calcs. above. If you go with my original post, without inflation adjusted annuity, this comes out with a bit more conservative risk ratio (a bit more weighted on the bond side). 😉
Scott
SPIA/Pension/SSI/etc. are fixed income so yes you get a giant fixed income allocation when you compute it in. So if you’re going to go by any rule of thumb (which lets all admit is a bit of a crap shoot anyway) than you would end up with much higher equity holdings to offset this large fixed income position.
That said some academic research is based on the presence of people having SSI so by taking it into account while they didn’t does mean that your starting with different assumptions to begin with… not always the best to use the conclusion of a study that starts with different assumptions on your own results.
I should add the caveat that this is only true of a single person.
Married people’s SSI’s are weird in the sense that the higher earning spouse is essentially a second to die on the spread between their social security benefits and their spouses.
Or another way to look at it(and results in the exact same mathematical result) is that the higher earning spouse is second to die inflation adjusted SPIA and the lower earning spouse is a first to die inflation adjusted annuity.
Nice piece, Michael. You, Wade, and Dirk are making invaluable contributions to retirement planning at just the right time when things looks so uncertain. I plan to use your techniques to project the value of my FERS pension, which I hope to draw sometime in the next 10-15 years (between ages 57-62). I hope that my current asset allocation of 70% stocks and 30% bonds isn’t too conservative for a man of 47, considering my FERS pension will cover between 30-40% of my high three. It seems most of my co-workers in the Federal government are 100% (mostly U.S.) equities.
Let us please not forget the impact of taxes. Social Security is taxable at varying rates depending upon income level. Maturities of a bond ladder are not taxable at all as they merely represent a return of principal. Annuities are also subject to tax but under formulas designed to identify which portion of an annuity payment is principal and which is interest. So in valuing of any these items for asset allocation purposes, different tax rules and assumptions should be applied.
Andy
Andy,
When you calculate a personal balance sheet, are you reducing the value of all the traditional IRAs and 401(k)s to account for the impact of taxes as well? (Serious question)
– Michael
Michael,
I commend you for yet another well-written and well-presented article detailing the characteristics of the Social Security Asset available to retirees and to aspiring retirees as they plan to receive retirement income. Your research and writing continue to inform many of us about critical issues as we move forward into retirement and I have benefited from your thought provoking work.
The benefit to the retiree of including some calculation of the lump sum value of SS benefits is profound, simply because SS is an asset. However, it does not appear on a
traditional balance sheet (nor do pensions). In my view, this represents a fundamental flaw in the traditional structure of balance sheets to exclude such rich sources of income as a significant asset from the portfolio of assets available to retirees. It is the primary reason Modern Retirement Theory (MRT) proposed a redefinition of the traditional balance sheet into what we referred to as the Retirement Sheet– a summary of assets and liabilities that expressly values all assets in retirement that can be used by the retiree.
I propose additional refinement may be possible in three areas:
First, the lump sum calculation as presented is good, as far as it goes. However, the assignment of
duration for SS payments and corresponding comparison to a bond is not accurate. The calculation is presumed to be mathematically accurate (I did not replicate since I have never found the
need to prove your work). The difficulty is conceptual not mathematical. The stream of SS payments has no known duration – payments continue for as long as they need to continue and for joint lives for joint benefit recipients. This is not captured in a calculation but should be. The actual lump sum value of SS benefits may be a rather small number or a very large number based on how long benefits are paid. We just don’t and cannot know how long this will be. So a range of lump sum values may be more appropriate to show a retiree if any are to be shown at all. Another way to present the lump sum value of SS may be to price an annuity with a similar stream of payments characteristic, something that cannot end as long as the recipient lives.
Second, you and others reference that getting the most payback from the taxes paid in is the proper perspective for viewing the timing of SS benefits. This perspective is found in the actuarially equivalent argument with respect to timing of initiation of benefits. This actuarially equivalent argument also presumes a duration based on life expectancy, a fact that no single individual will ever know with certainty. This is only one way to view this issue. Another way is to maximize the monthly cash flow received from the SS benefit and this can only be done at the age of 70 under current rules. MRT starts with the view that SS benefits are derived from sunk cost investment in taxes. As a near retiree, I do not aspire to maximize my payback, but rather to maximize my monthly cash flow and will delay, under my current personal situation until the age that maximizes this cash flow (as well as the survivor benefit for my spouse).
Third, you state that “One notable caveat, … is the inclusion of Social Security on the personal balance sheet can actually lead to a materially ‘distorted’ asset allocation, given that most would characterize Social Security as the asset-class equivalent of a government bond (or more
accurately a TIPS bond given its inflation characteristics”. I would argue that the exclusion of SS
stream of payments is a greater source of distortion and does not accurately give the retiree the information needed to make sound judgments about retirement income funding. My view of
the SS stream of payments is that of an asset class of “Other”, neither equity nor bond.
MRT highlights the merits of Social Security Asset characteristics beyond merely a present value calculation to determine how best to use it for individual retirees. These distinct and notable characteristics are that Social Security:
1. can never be fully consumed, therefore it is sustainable over one or more lifetimes. Income
derived from the SS Asset can be consumed as received, but the underlying Asset from which income is produced can never be fully consumed.
2. is tax advantaged making it an efficient source of retirement income. It should be considered first in establishing an income base
3. is inflation adjusting thereby preserving purchasing power when compared to its adjusting index.
4. represents a commitment from the federal government, therefore representing a secure
source of income.
5. is uncorrelated to financial markets, therefore stable.
6. can only be taken as a stream of annuity payments, therefore promoting prudent expense management.
7. supports joint annuitants thereby providing a stream of annuity income for survivors.
8. under normal conditions, cannot be taken prior to age 62. Asset grows significantly,
based on mortality returns, if income is delayed until normal retirement age or, optimally, age 70.
MIchael,
Excellent point on tax effecting non Roth IRAs and 401ks. I believe all balance sheet assets that will be converted to cash in hand for retirement purposes should be tax effected. The problem, of course, is what rate to apply. Granted, that may involve some guesswork. In any case, I think the critical point is to recognize which balance sheets assets bear a potential income tax burden and which do not. Certainly, one would think that 100 dollars of cash held in a 401k is worth less than 100 dollars cash held directly because the 401k cash has yet to be taxed. On the other hand, the 401k cash can accrue interest on a tax deferred basis and the cash held directly cannot, at least at an equivalent risk adjusted rate. If the period of 401k deferral is very lengthy, perhaps this difference can be overcome. If you are dealing with a potential inherited IRA, the deferral can also be very meaningful.
Also, some have commented that one way to value Social Security would be to determine the cost of an equivalent payout annuity, but this also would ignore the different tax treatment of Social Security payments and annuity payments. How to quantify the tax differences in any particular case is something I will leave to you, Wade Pfau and others! In any case I believe retirement models should be run after tax by using a various range of tax assumptions. When they are not, that at least should be made clear to the reader.
By the way, I find your periodic columns very helpful.
Andy
The allocation of savings to Bonds vs. Stocks is by itself arbitrary. Where in this allocation should one include rental properties? or vacation homes? or Jewelry and Art collections?
To the extent that you view Bonds in the Bonds vs. Stocks allocation to be the safer of the two possibilities – then your NPV of SS goes into Bonds. To the extent that you view your allocation based on liquidity, then perhaps SS belongs in the category of Jewelry and Art Collections – one that is not in the bifurcated asset allocation of Bonds v Stocks.
Perhaps the simple distribution into just two classes of assets in insufficient.
this is very good. i know a lot of people who don’t recognize ss as an asset. the difficulty of calculating present worth factor comes from the pathetic interest rate information that we have, and the way politicians like to freeze colas. i started getting ss at 62 and those of my age who wait until 70 will not likely get more money out of the system until we are all over 80, by which time, who cares. thanks for posting
For many, SS is a low value asset due to a generous retirement from elsewhere. For the rest of us, it’s life or death. This articles makes the mistake of many such articles in that it brings in too many variables. If this is your situation, look at it this way. If you’re in this different situation, then look at it this other way. That’s over complicating the issue.
There is one factor that makes any difference – your expected age at death. If you have a family history (parents, grandparents, aunts, uncles, cousins, etc.) of natural death in the 50s or 60s, then, by all means, if you live to 62, you need to take what you can get as fast as you can. If your ancestors were smokers and died of cancer, take your situation into account. With my family I expect to live into my 80s if I don’t have an unfortunate accident. In that case, taking SS at 62 would be a penalty (using NPV analysis). I happen to be 68, and a friend of mine told me I should have retired 3 years ago. Why, I’ve been working? Because by now I would have collected nearly $60,000 in benefits which would have gone straight into my investments. Looking at the income streams (not NPV) from starting at 65, 68, or 70, all three streams tend to converge in my 80s. Looking at NPV at age 65, 68, and 70, there’s not much difference. I should have retired at 65 and saved it while I was working. If I started at 65 I would have collected $190,000 by age 70. You have to live a long time to make up that difference with the higher payment from waiting. So I am seconding my friend’s advice – retire from SS at age 65 and keep working if you and and want to. Here’s what the graph looks like.
https://uploads.disquscdn.com/images/f0d889863e786298defbf133af3d9d5b0dbf703290a31c67ed55679171bee532.jpg
Very interesting article and comments, many seem to come from people who are involved in the financial industry (most still working.) All seem overly concerned with things like asset allocation the traditional 50/50 bonds to stacks. I have been retired almost 4 years starting taking SS at 66 still working had two dependent children (twins, boy and girl) the additional money for the dependents at full retirement age in my case was over $800 per month each which was set aside for college. Retired at 66 1/2.
My wife and I were prodigious savers and accumulated ($800,000. + in several retirement accounts and over 2 million in Vanguard accounts).
Looking at returns over the past few years accounts keep growing averaging over 8% total returns. Considering most advisers have said 4% withdrawal is safe we estimate $120,000.00 from our investment portfolio $45,000 from our two SS checks and some misc. outside income stream we are extremely comfortable with our modest life style. We live in the mountains of Utah have no debt and our major expenses our finishing the twins college education and travel.
If you look at SS as 4% return on an investment portfolio our $45,000 per year would be an asset of close to $1,100,000.00
SS is the first thing we spend, then my deferred compensation and now that I am 70 1/2 adding the RMD
to income. Our dividend stocks fill most other needs and returns on mutual funds are mostly reinvested to prepare for future and leave an estate for the twins (I was fifty the year they were born).
In conclusion a simple valuation for cash flow is total yearly SS payment equals 4% of asset value.
One thing not mentioned is that nothing remains of SS when you are gone so as an asset to be part of an estate it is worth nothing (it does go to spouse but stops when she does.
I agree with you and it is quite difficult to find informative blogs that provide reliable information. I was looking for these kinds of blogs and I have come across your website.
Good work and I am looking forward to your next post!
I found this blog post to be quite well-written, well-researched, and informative, with one somewhat glaring exception. Your use of the term “in point of fact” is akin to the curious and oft-used term “at this point in time.” Each term, respectively, should simply be reduced to “in fact,” and “at this point.”
So glad to find someone discussing trade-offs in delaying Social Security in terms of PV (though it appears I’m 5 years late to the party).
One could also see it this way. A person at 66 trades $1 current income for $.08 lifetime annuity. With TIPS rates so low and with future payments inflation protected, we could estimate NPV simply as $.08 times conditional life expectancy less a dollar, a net gain for both sexes.
The problem with this calculation is that the TIPS rate does not reflect the risk that the person will not live long enough to recoup the dollar: people who delay get a higher average payout, but their payout is more volatile. For many risk-averse people, this is a deciding factor. However, a woman would need a 58% discount rate to make this trade unattractive. Not many healthy 66-year-old women that I know would pass up the opportunity to earn 57 cents on the dollar in one year’s time.
Michael: Excellent article, as expected from you. I’m reading in 2019, and the post has not aged. Here’s a deeper look at the “Wait” vs. “Take Now” math that you only touched on. I’ll use an example. I’m 64, an ex-exec, was just laid-off from my job and unlikely to get regular salary/income beyond nominal contract work the next few years. $800K in Traditional IRA. No debt. I needed to evaluate if I should spend equivalent IRA monies now for living expenses in lieu of SS, and “Wait” as every analyst seems to advise for my SS to grow from 2.6K/mo. now to 3K/mo at 66, to 4.0K/mo at 70. On the surface, Wait might appear to be prudent, but they all forget that “you’ve got to live on something.” You simply have to do the simple spreadsheet modeling to see that the benefits of Take Now far exceed decrementing my IRA. My model shows at only 2% IRA growth (e.g. US treasuries) and 2% SS cola, crossover in favor of Wait only occurs at age 95! Assuming 3% IRA growth, it never crosses over. Understood there are tax, RMD, survivor, and spousal considerations, but we all should first analyze the underlying math. It’s eye-popping!
Factoring in the spousal benefit is critical for many married couples who are just now becoming eligible for SS. Wives of executives who had to move frequently, military officers, diplomats, etc., often had no chance to have a career or even achieve the 40 quarters of work needed to qualify for SS on their own. They can get a 50% spousal benefit based on a well-paid career of their husbands, but that benefit reaches its maximum at age 66 and it cannot be started until the earning spouse starts benefits. Let’s assume a couple of the same age: Delaying until age 70 might increase the nominal value of the career person’s benefit, but his/her spouse would forego four years of benefits for with NO increases beyond age 66. So the nominal 8% annual reward for delaying beyond 66 really is on only two thirds of 8%, or 5.67% for the couple, and this is offset by four years of no benefits at all for the couple. It would be hard for an advisor to recommend waiting beyond age 66 for married couples in that situation.
This is interesting Mike but ignores another aspect of this scenario. Let’s say, if the husband passes away around age 72 (common situation), then the widowed spouse would only collect the 2/3 portion in perpetuity as a survivor benefit. And that is the portion that continued to increase until age 70. So, in this case, the waiting until age 70 strategy seems to be the better one. Of course, you don’t know this outcome at age 67, but it seems like the peace of mind that does with this form of longevity protection is maybe
a better choice.
I agree this is a very good discussion. I recall having some courses in finance back in 1989 as an undergraduate in Chemical Engineering! I have to admit though, my knowledge of finance from those courses back then have been invaluable. It is a type of deffered annuity where a PV can absolutely be calculated. I use Quicken and wish it had a way of incorporating SSA payments into its net worth reporting. Till that time if ever I use Google Sheets to do this. But I agree this is an excellent discussion of a very germane topic.