Executive Summary
The first half of 2026 has seen significant headline-driven market uncertainty, from geopolitical events to inflation risk. Given the level of uncertainty, many investors might have assumed that equity markets would be down midway through the year. Yet, the S&P 500 has posted positive returns (hitting several all-time highs earlier in the year) amidst continued strong corporate earnings, rewarding those who have been able to look past the headlines and remain invested.
In this article, James Liu, CEO of Clearnomics, explores how advisors can put news headlines into context for clients in a data-driven way, helping them maintain perspective and recognize that periods of uncertainty don't necessarily lead to weaker equity market returns.
Looking at equity markets, the energy sector has been a standout performer in the first half of the year amidst the spike in oil prices associated with the conflict with Iran, though certain technology stocks have been supportive as well amidst continued enthusiasm surrounding developments in Artificial Intelligence (AI). International stocks have also joined the U.S. market in experiencing positive returns for the first half of the year, with both developed and emerging markets posting gains. At the same time, valuations (as measured by the S&P 500's forward price-to-earnings ratio or the Shiller Cyclically Adjusted Price-to-Earnings [CAPE] ratio) remain elevated in historical terms (though these data points don't necessarily predict where the market is heading next).
Inflation has perked up this year, with the Consumer Price Index (CPI) rising 4.2% year-over-year in May, representing a multi-year high. However, this figure was largely driven by its energy subcomponent, which jumped 23.5% year-over-year, with core CPI (which excludes food and energy) rising only 2.9% over the same period – suggesting that if declines in oil prices seen over the past few weeks continue, the headline inflation figure could moderate.
In addition to affecting the prices consumers pay, inflation also plays heavily in the minds of decision-makers at the Federal Reserve (alongside the labor market, which has strengthened this year). After starting rate cuts in late 2024, expectations for further cuts flipped earlier this year, with investors now anticipating rate hikes in the coming months. The Federal Open Market Committee appears divided, with roughly half of members expecting rates to remain steady through year-end and the other half expecting them to move higher.
Although future Fed interest rate decisions remain to be seen, current interest rates remain elevated across all maturities of the U.S. Treasury yield curve. While bond returns have been relatively subdued so far this year amidst higher rates, current yields could help restore fixed income to its traditional role as a portfolio stabilizer and income generator. On the other side of the coin, higher bond yields could serve as a headwind for equity prices, as they increase the attractiveness of bonds as an alternative and raise the discount rate applied to future earnings.
Ultimately, the key point is that while headlines can often drive short-term market moves, underlying fundamentals, such as corporate earnings, typically drive long-run returns. Which suggests that financial advisors have a valuable role to play by providing clients with perspective on the broader market picture and showing them how their asset allocation is designed to meet their short- and long-term goals!

The first half of 2026 supported investors in ways that few expected at the start of the year. Markets climbed to new all-time highs, corporate earnings grew at a double-digit pace, international stocks outperformed, and the labor market accelerated. At the same time, the war in Iran pushed oil prices to multi-year highs, inflation changed the Fed's policy path, and the sustainability of artificial intelligence (AI) spending continues to be questioned.
To long-term investors, it may feel as if the same set of topics shifted in and out of focus throughout the first six months of the year, causing markets to climb higher but with short periods of volatility. This combination of underlying economic health and headline risk is not unusual. Markets have navigated geopolitical shocks, energy disruptions, and shifting Fed expectations many times before. What history consistently shows is that portfolios built on sound principles and a long-term perspective tend to weather these periods well.
This ever-changing landscape is why it's important for financial advisors to provide clients with clear perspectives. The goal of this mid-year outlook is to help you frame the key themes shaping markets and portfolios today. Each section below includes charts, key data points, and perspectives designed to support client conversations.
Click to download a PDF of the charts.
All of these charts can be customized with your own branding using a free version of the insights platform, Clearnomics Community. The 10 charts are also downloadable here in a full PDF.
1. Markets Hit New All-Time Highs
U.S. stocks have climbed to 24 new record highs this year, supported by double-digit corporate earnings growth across many sectors (according to statistics from the S&P 500 Index through June 30, 2026). This has occurred despite macroeconomic headlines driving market swings, particularly as oil prices have fluctuated. For investors, it's important to remember that markets have a long history of growing through periods of uncertainty, and ultimately reward those who remain disciplined and stay invested.
Within U.S. equities, the energy sector was a standout performer in the first part of 2026 as energy prices rose from the end of February through May. While it has declined since then alongside falling oil prices, the sector has still gained almost 20% this year on a total return basis. Technology stocks have also supported broad market returns, driven by enthusiasm for AI. This has fueled a wave of high-profile initial public offerings, including SpaceX's debut in the second quarter. Additional IPOs from major AI firms are anticipated in the coming months, reflecting the appetite for growth stories.
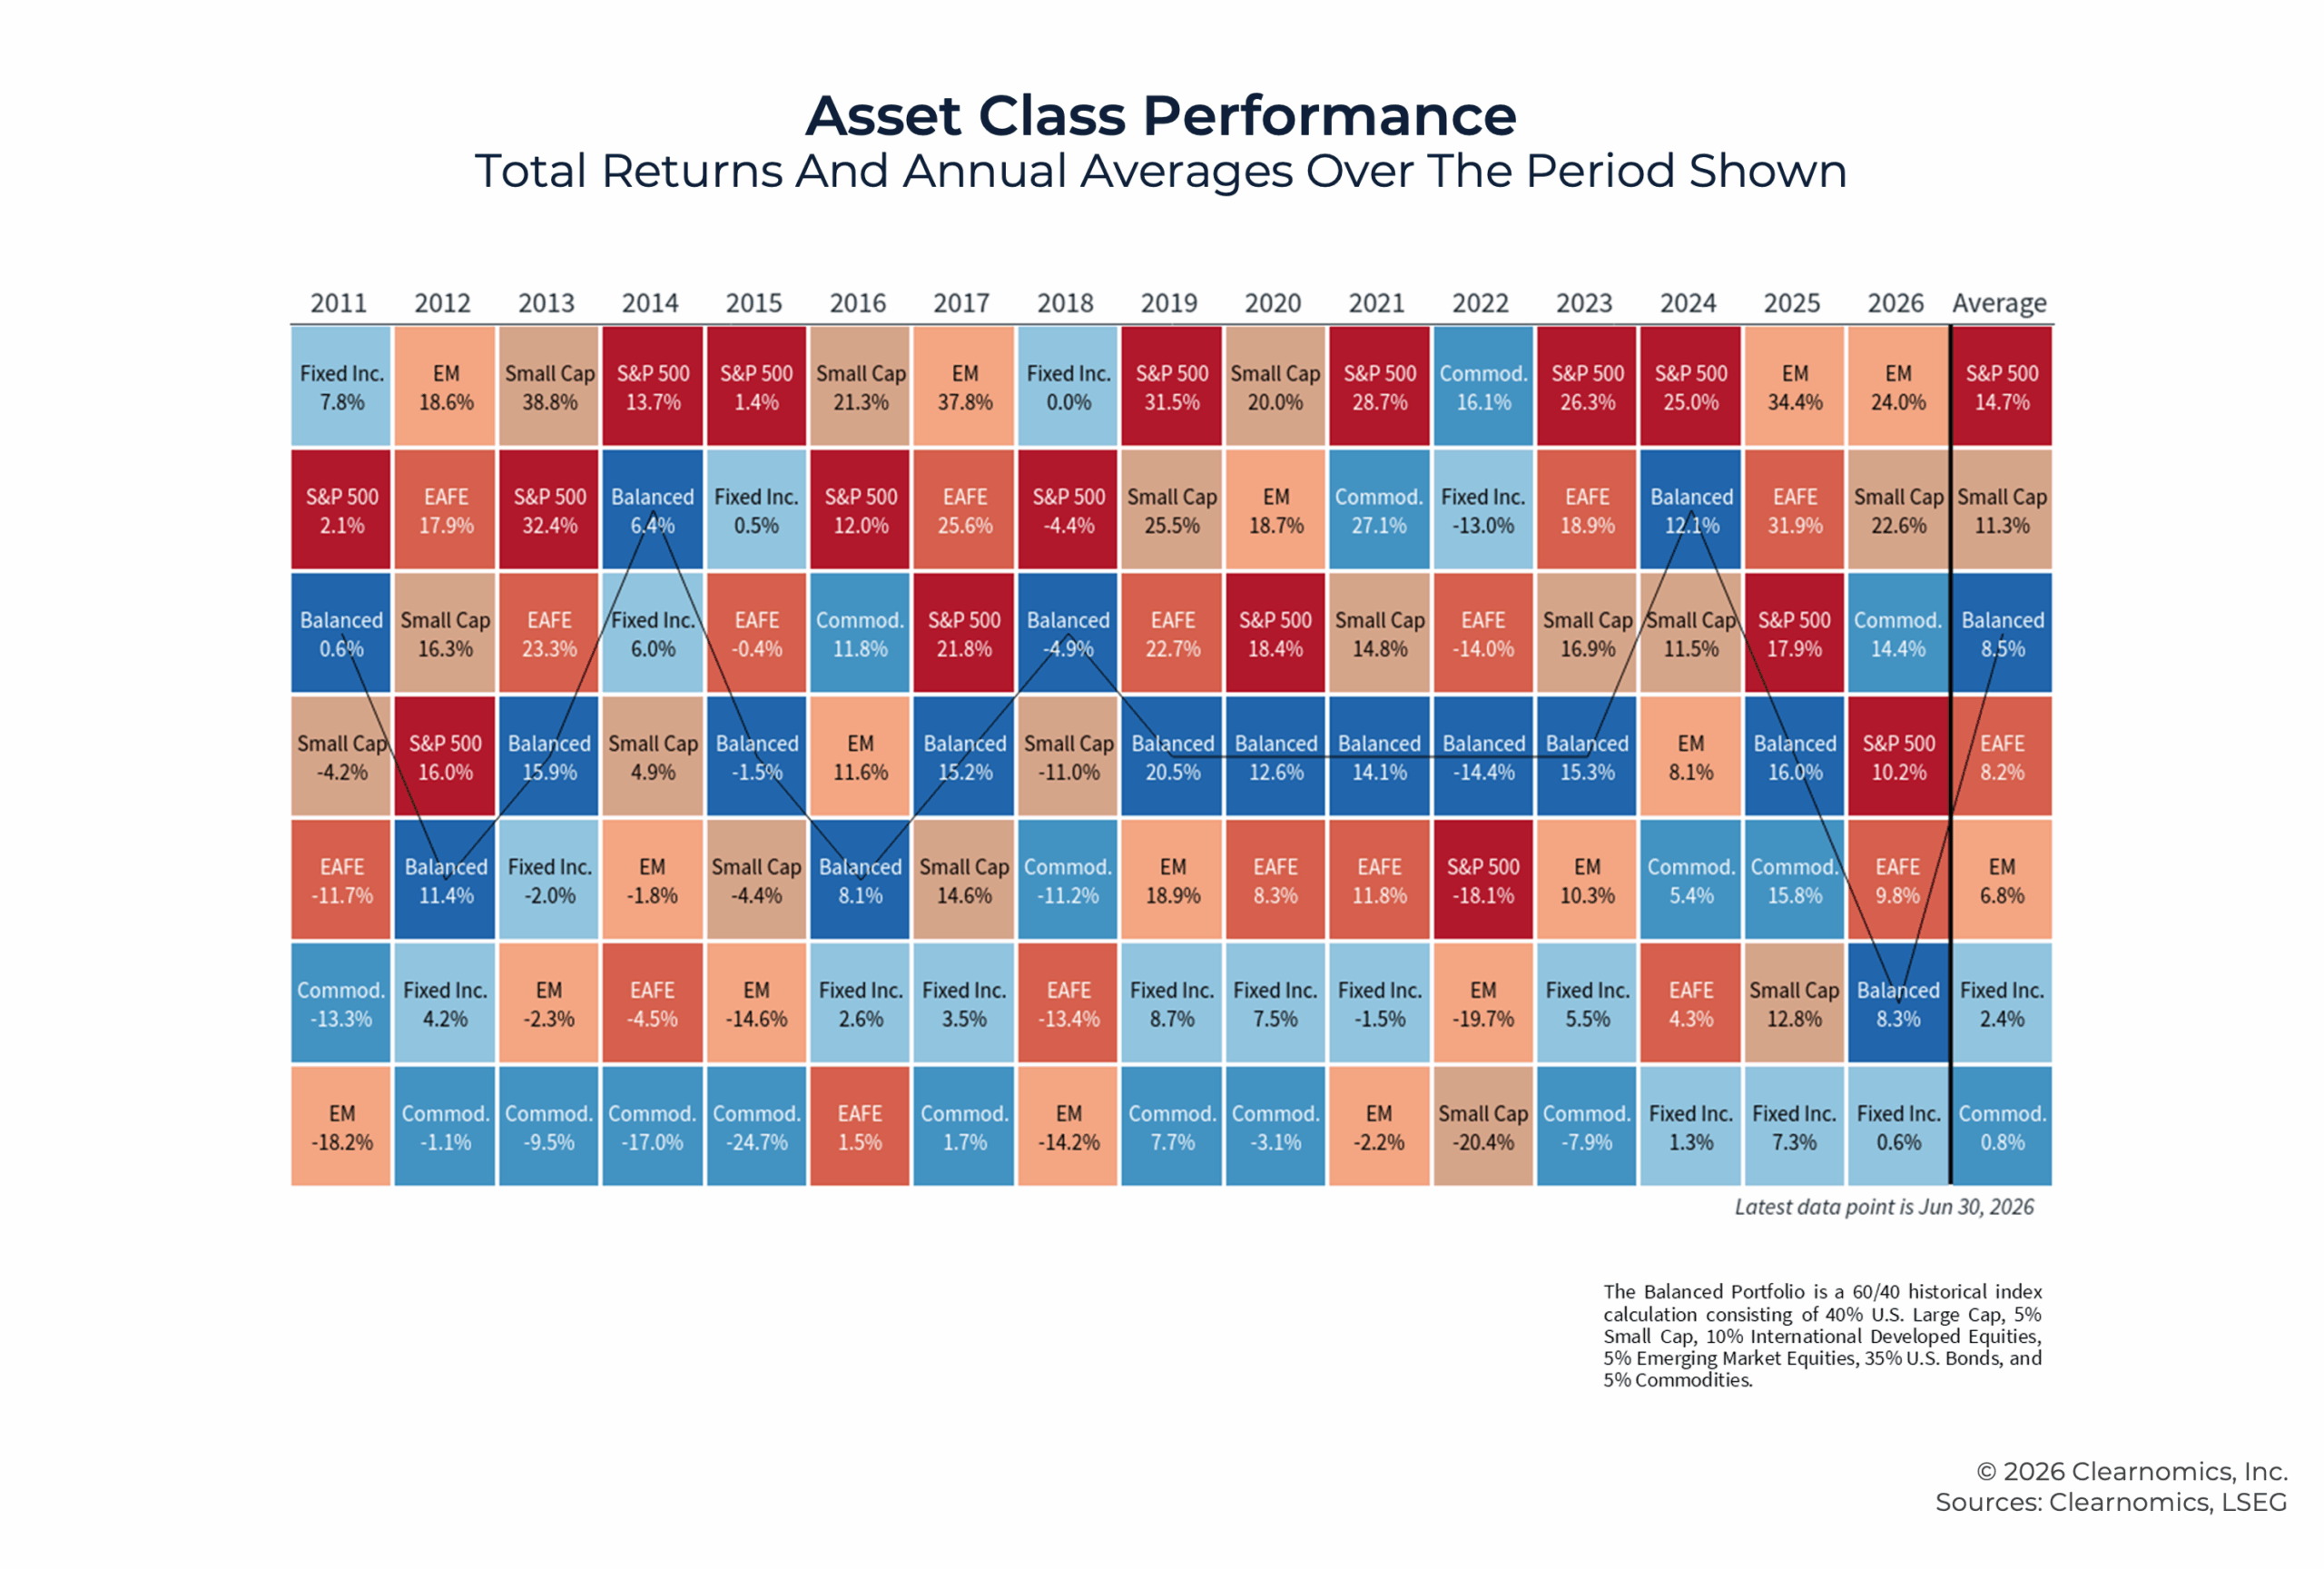
Strong performance has not just been limited to U.S. stocks. The breadth of performance this year has been one of the most positive developments for diversified portfolios, continuing last year's trend. International stocks, small-cap equities, and commodities have all delivered double-digit returns year-to-date, with emerging markets leading all major asset classes at nearly 24% in the first half (All returns figures are total returns as of June 30, 2026). EM stocks performed well due to AI trends supporting countries such as South Korea and Taiwan, a somewhat weaker dollar, and steady broader economic trends.
At the same time, valuations remain expensive. The S&P 500 currently trades at a forward price-to-earnings ratio of approximately 20x, above the long-term historical average of around 16.0x. While this is elevated, it remains below the dot-com era peak of 24.5x, and is supported by corporate earnings growth that is running well above the historical average at over 20% on a trailing basis. The Shiller cyclically adjusted price-to-earnings (CAPE) ratio, which accounts for inflation-adjusted earnings over ten years, is also historically expensive.
High valuation readings do not predict what the market will do next, but they do affect asset allocation decisions. In this environment, maintaining appropriate diversification across asset classes, regions, and sectors can potentially help manage risk.
Here are some of the key highlights from the first half of 2026:
- The S&P 500 returned 10.2% with dividends in the first half of the year, reaching multiple new all-time highs despite concerns over geopolitics, inflation, and Federal Reserve policy uncertainty.
- Broad asset class performance was notably strong, with emerging markets (+24.0%), small-cap equities (+22.7%), and commodities (+12.3%) all outpacing U.S. large-cap stocks.
- Energy (+19.7%), industrials (+20.2%), and information technology (+19.8%) were the top-performing S&P 500 sectors, while consumer discretionary and financials lagged.
- Corporate earnings growth remains well above the historical average, increasing by 20.8% for the S&P 500 over the last year, helping to ease the strain of high valuations. In fact, all sectors experienced positive earnings growth, with technology being the standout with an expected earnings-per-share growth rate of 39.6%.
For advisors, the main client takeaway from the first half of 2026 is that market performance and uncertainty are often two sides of the same coin. Markets are often the most attractive during short-term pullbacks, and there is a long track record of major indices climbing the so-called 'wall of worry'. This means that investors who remain invested are often rewarded for doing so. In addition, the breadth of performance across asset classes this year illustrates why a well-constructed portfolio, rather than a concentrated bet on any single theme or region, is the best way to achieve financial goals.
2. The War In Iran And Oil Prices
The war in Iran has primarily impacted the U.S. economy through the energy markets. The disruption of oil transportation throughout the Strait of Hormuz pushed Brent crude to nearly $120 per barrel at the end of March and again in late April. Since then, prices have pulled back significantly and ended the second quarter not far from their pre-conflict levels of around $70 per barrel. During that time, uncertainty around an escalating conflict and possible ceasefires and peace deals led to many periods of market volatility.
At the pump, gasoline prices have followed a similar trajectory. The national average for regular unleaded gasoline peaked above $4.50 per gallon in May before retreating to under $4.00 per gallon more recently. For context, the long-term average since 2009 is approximately $2.99 per gallon, which means consumers are still paying a premium relative to recent history.
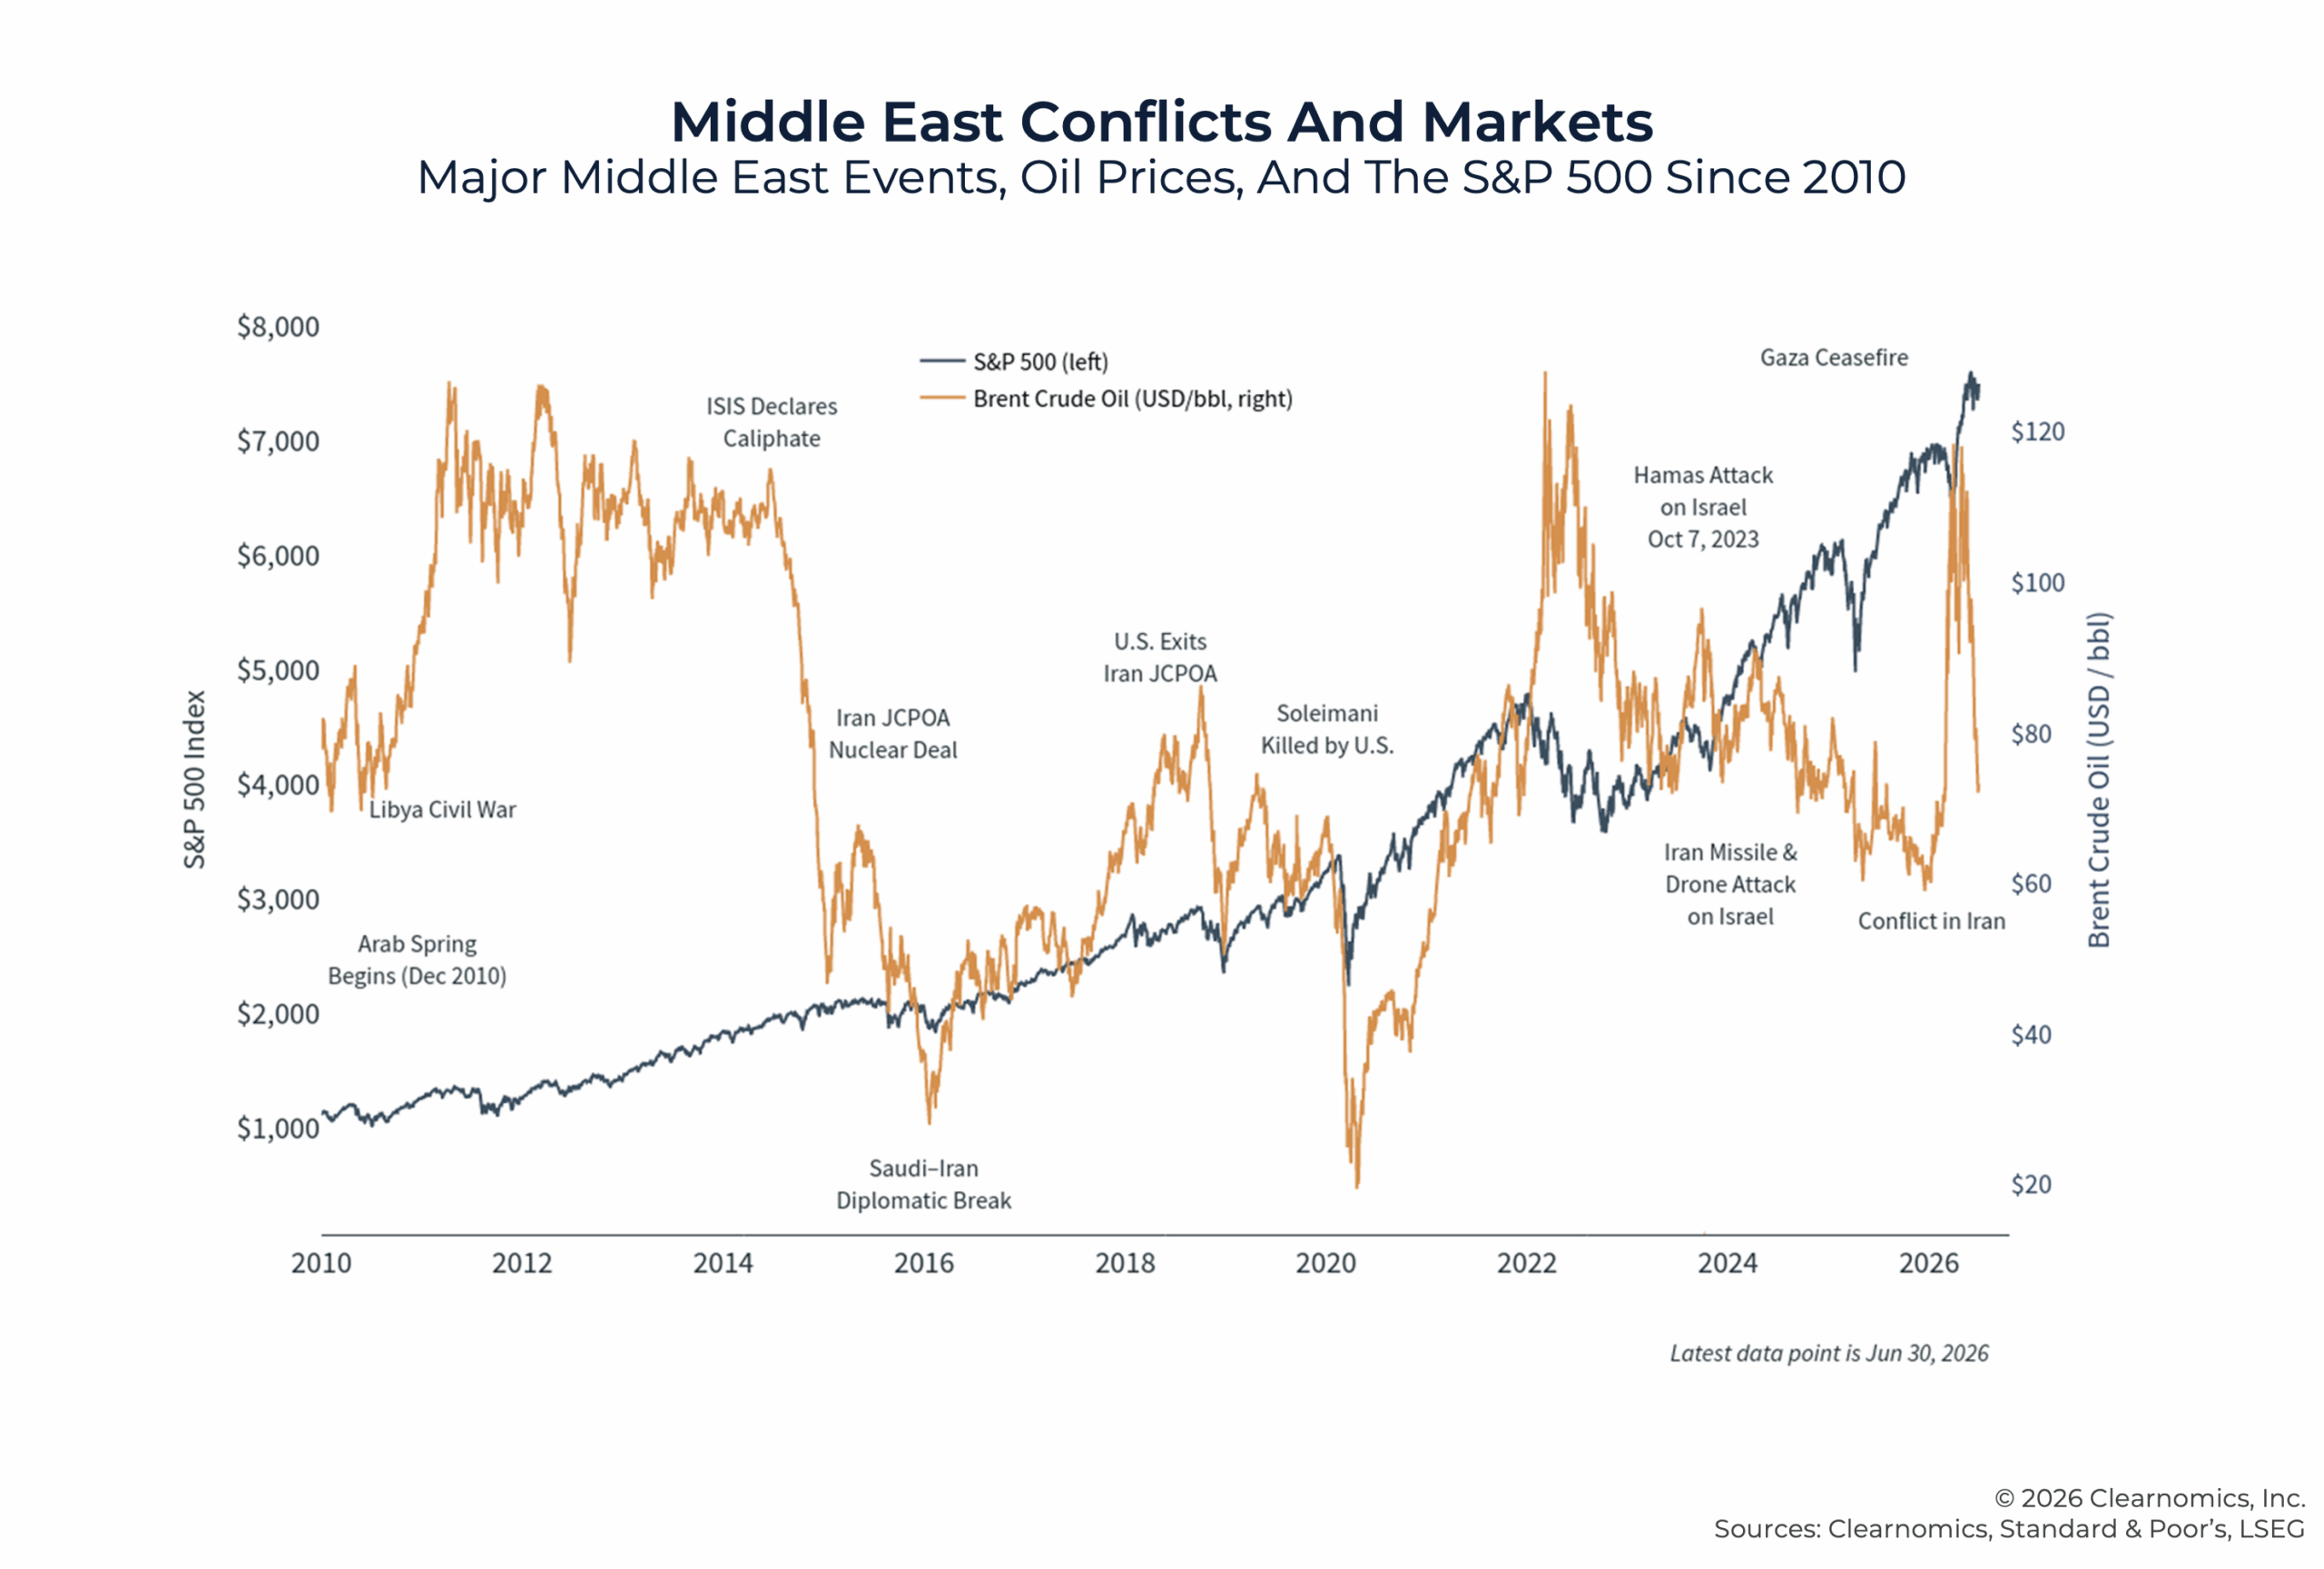
While geopolitics can seem complex, the reality is that Middle East conflicts have rarely had a lasting impact on markets. For client conversations, here are some of the key points:
- Brent crude rose from approximately $70 per barrel before the conflict to a peak near $120, before falling back again. This reflects optimism around a preliminary peace agreement, which has faced several false starts, and the slow reopening of the Strait of Hormuz.
- History shows that supply-side energy shocks tend to be temporary. The oil price spike that followed Russia's invasion of Ukraine in 2022 eventually faded as supply chains adjusted and demand moderated.
- Events outside the Middle East have had larger impacts on oil prices over the past decade. For example, the fact that the U.S. is now the world's largest oil producer means that oil prices have remained relatively low since around 2014. This also means that the U.S. is somewhat more insulated from supply shocks than in the past, especially when compared to historical periods such as the 1970s.
- The U.S. and the International Energy Agency (IEA) have also released oil from their reserves to help cushion the supply crunch. Specifically, the U.S. Strategic Petroleum Reserve (SPR) has been drawn down by 84 million barrels since March, roughly a 20% decline.
Supply disruptions can raise prices quickly, but they also tend to resolve themselves as the geopolitical situation stabilizes.
3. Peak Inflation
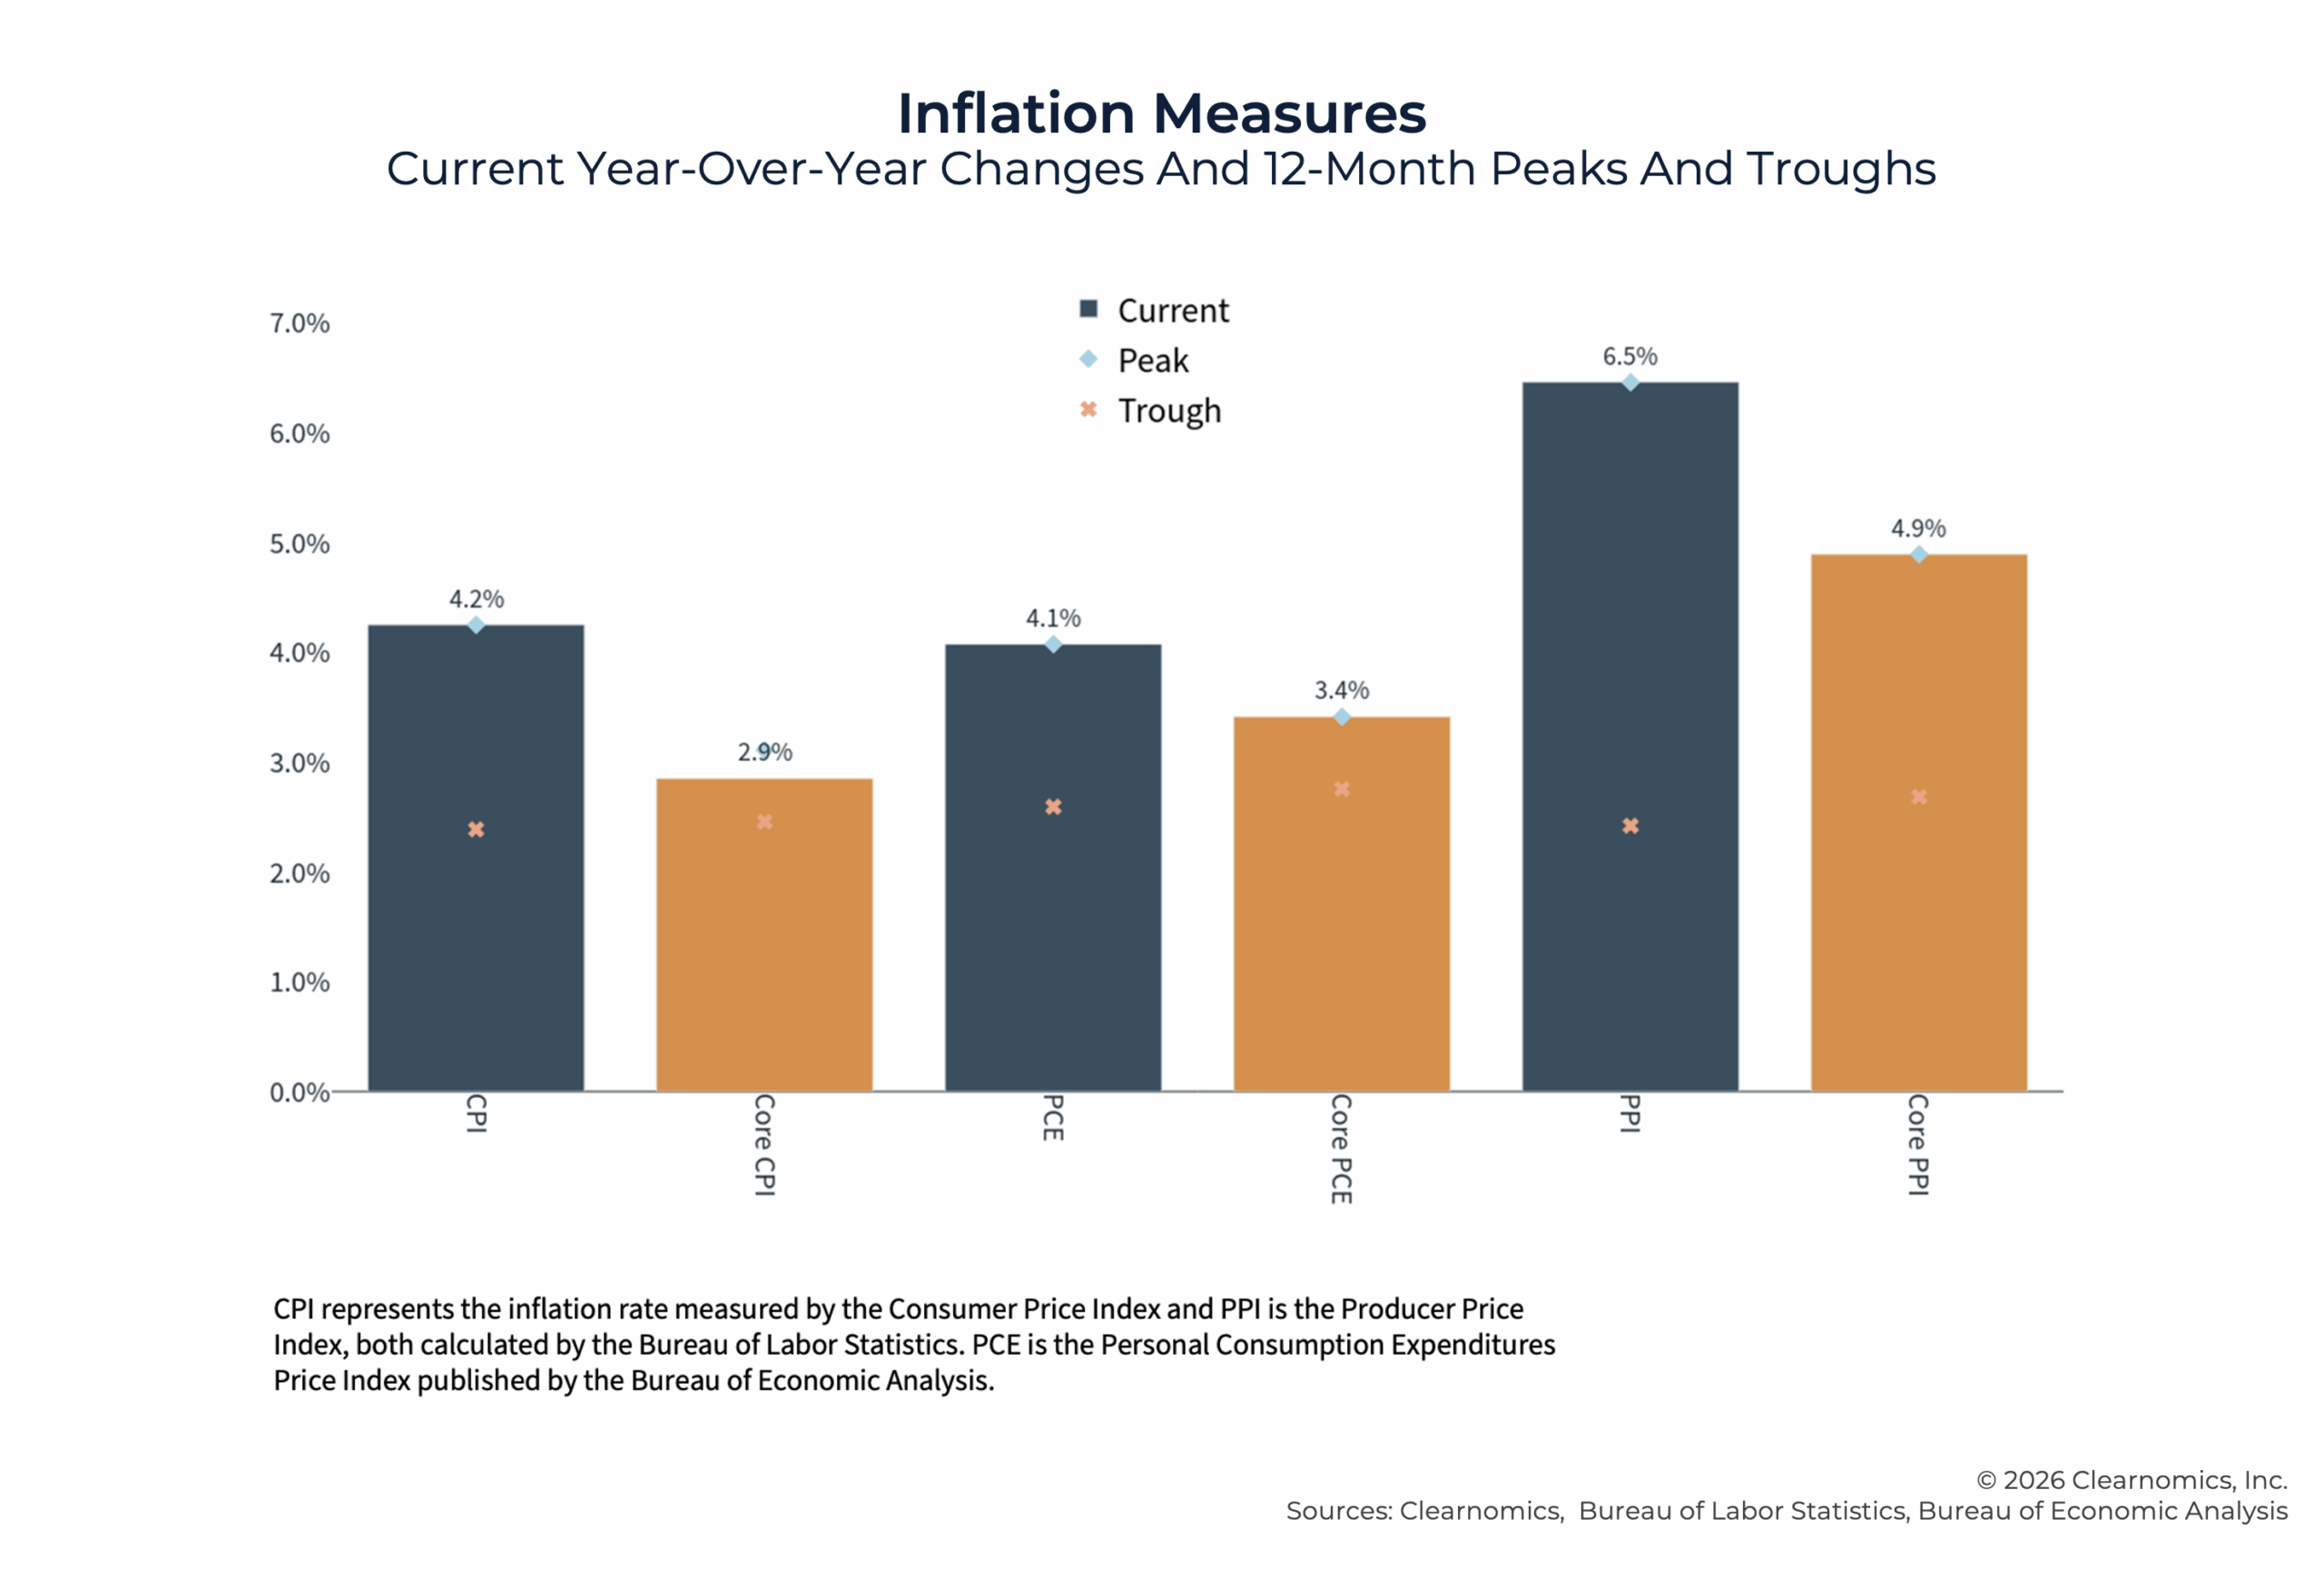
Oil price spikes have fed directly into headline inflation, since energy is a significant component of headline figures. In May, this increased the Consumer Price Index by 4.2% year-over-year, its highest reading in several years. The energy subcomponent jumped 23.5%, with gasoline prices rising 40.5%. Importantly, core CPI, which excludes food and energy, rose only 2.9% over the same period.
The goal of studying different inflation components is to try to pinpoint which factors are driving inflation. The distinction between headline and core CPI matters because it suggests that higher oil prices have not yet spread broadly across the rest of the economy. Economists often describe this kind of price pressure as a supply-side shock, which tends to be more temporary than the demand-driven inflation experienced from 2021 to 2023. With oil prices having improved, it's possible that inflation measures such as CPI are near a peak.
Here are some key talking points advisors can use when discussing this topic with clients:
- CPI at 4.2% year-over-year and Core CPI at 2.9% both remain above the Federal Reserve's 2% target, but the wide gap between headline and core inflation highlights that energy is the primary driver of the current readings.
- Economists exclude different categories not because they don't affect consumers, but to try to understand the different sources of inflation. These special aggregates show that recent price pressures are driven primarily by energy.
- For consumers, the prices of many necessities have remained high. For example, the categories of Apparel, Transportation Services, and Medical Care Services within CPI have grown 4.8%, 4.1%, and 3.6%, respectively, over the past year.
Inflation rates have improved, but this only means that the rate of increases has slowed – not that prices will come back down. Naturally, this has many consequences for portfolios and financial plans as advisors help investors to outpace inflation with both growth and income.
4. The Fed Under Kevin Warsh
There was a Fed leadership transition in May when Kevin Warsh was confirmed as Fed Chair, succeeding Jerome Powell. Warsh served on the Federal Reserve Board of Governors from 2006 to 2011 and thus is no stranger to the central bank. For investors, there are important questions on how this leadership transition will shape monetary policy.
The current environment presents Warsh with a complex set of trade-offs. The federal funds rate stands at 3.50% to 3.75%, down from a cycle peak of 5.25% after rate cuts that began in late 2024. Expectations for further cuts flipped earlier this year, with investors now anticipating rate hikes due to both inflation and a strengthening labor market. However, if inflation truly has peaked, then this could change the Fed's decision-making.
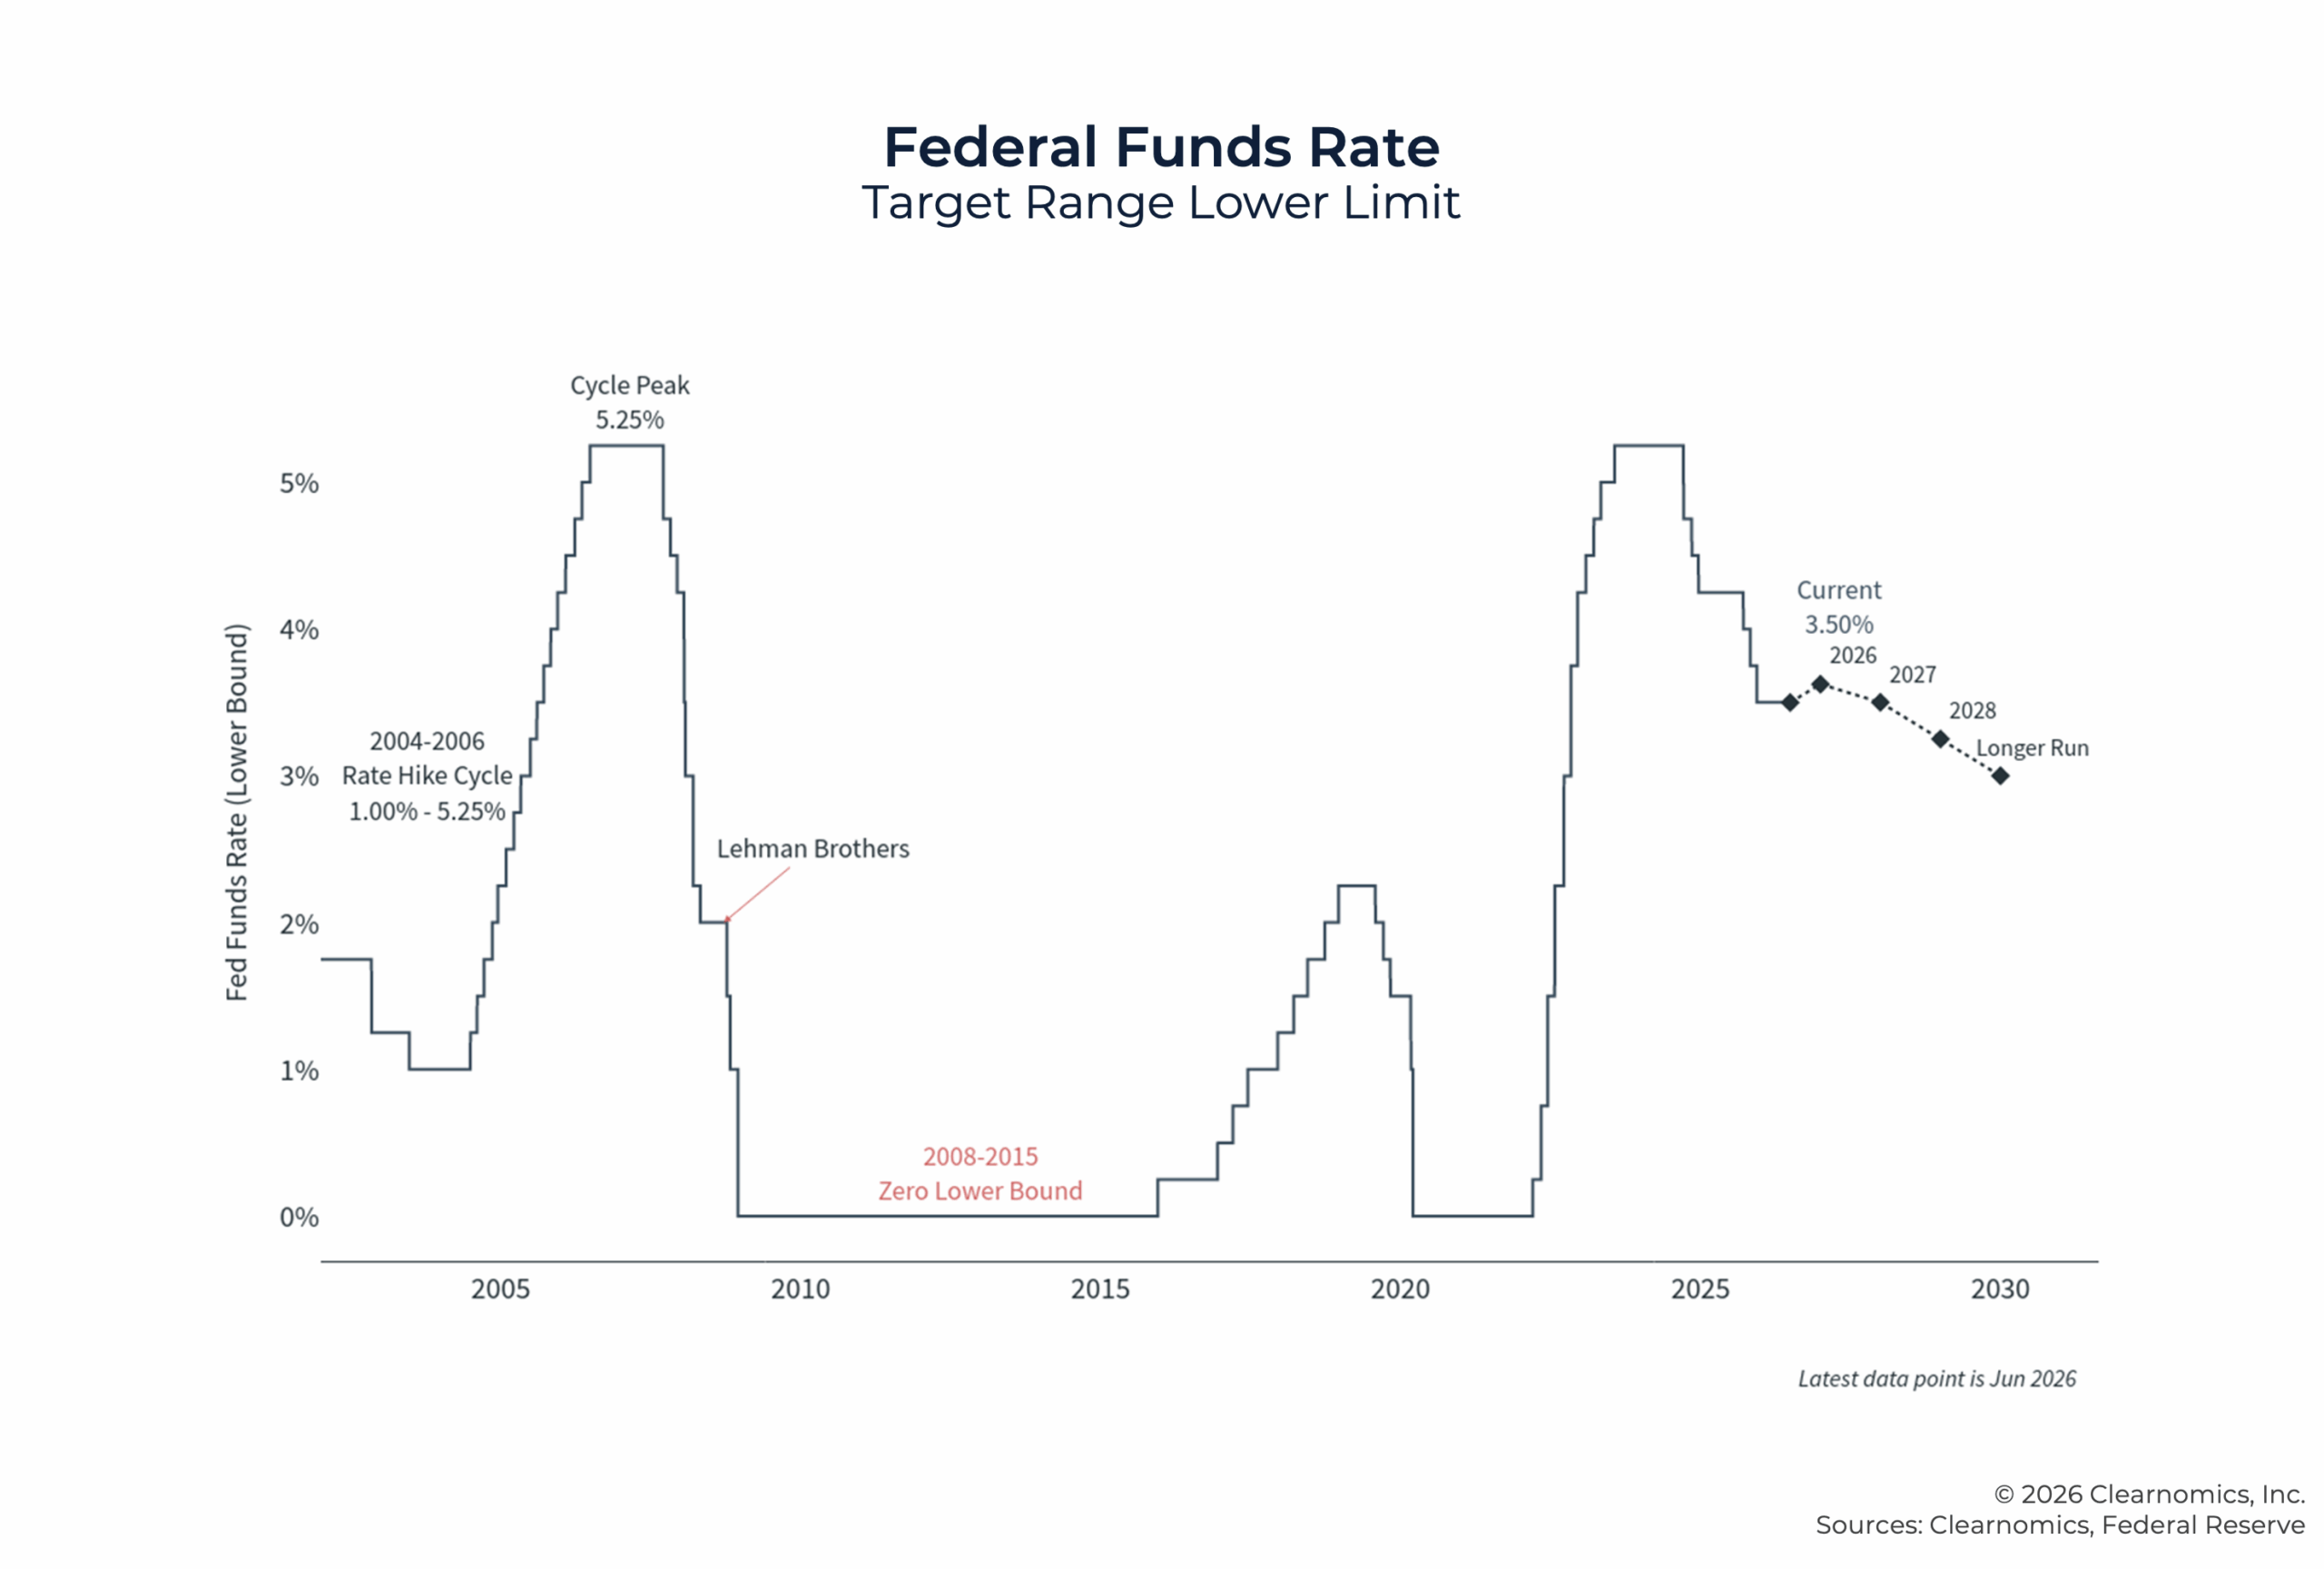
When it comes to client conversations, here are the main considerations that will influence the Fed:
- The pace of further policy changes will depend on how energy prices and inflation evolve in the coming months, making the outcome of the Iran conflict a key variable for monetary policy.
- At his first FOMC meeting in June, Warsh introduced several changes, including shortening the Fed statement, removing forward guidance, and launching five working groups to study communications, the inflation framework, the balance sheet, AI and technology, and the data the Fed uses to assess the economy.
- The Fed's balance sheet currently stands at approximately $6.7 trillion, down from its peak of nearly $9 trillion in 2022. Warsh has historically argued for a smaller balance sheet. The working group studying this topic could signal further reductions in the months ahead, which may affect financial conditions and borrowing costs across the economy.
- The Fed's own projections show that the FOMC is divided, with roughly half of members expecting rates to remain steady through year-end and the other half expecting them to move higher.
Overall, it's important to remember that Fed projections, based either on the FOMC's Summary of Economic Projections or federal funds futures, can change quickly. Thus, it's important to not overreact to apparent shifts in policy. Additionally, Fed leadership changes tend to matter less than the economic fundamentals the Fed is responding to. In other words, while the Fed does implement important policy that affects the economy and financial system, and may indirectly influence investment trends in AI, productivity growth, and demographic trends, they are often reacting to trends, rather than driving them.
5. The Midterm Election: What History Says About Political Cycles And Markets
With November 2026 approaching, the U.S. midterm elections will begin to attract attention from the financial media, prompting questions among clients. It is natural for investors to wonder how a potential shift in Congressional control might affect tax policy, government spending, and regulatory priorities. However, the historical record consistently shows that election outcomes have had far less influence on long-term market performance than most investors might expect.
Importantly, over almost a century, markets have been positive under every combination of political party control, on average. When midterm or presidential election years did produce poor returns, the cause was almost always something unrelated to politics. For example, 2002 was shaped by the aftermath of the dot-com bust, 2008 by the global financial crisis, and 2022 by the most aggressive Fed rate hike cycle in four decades.
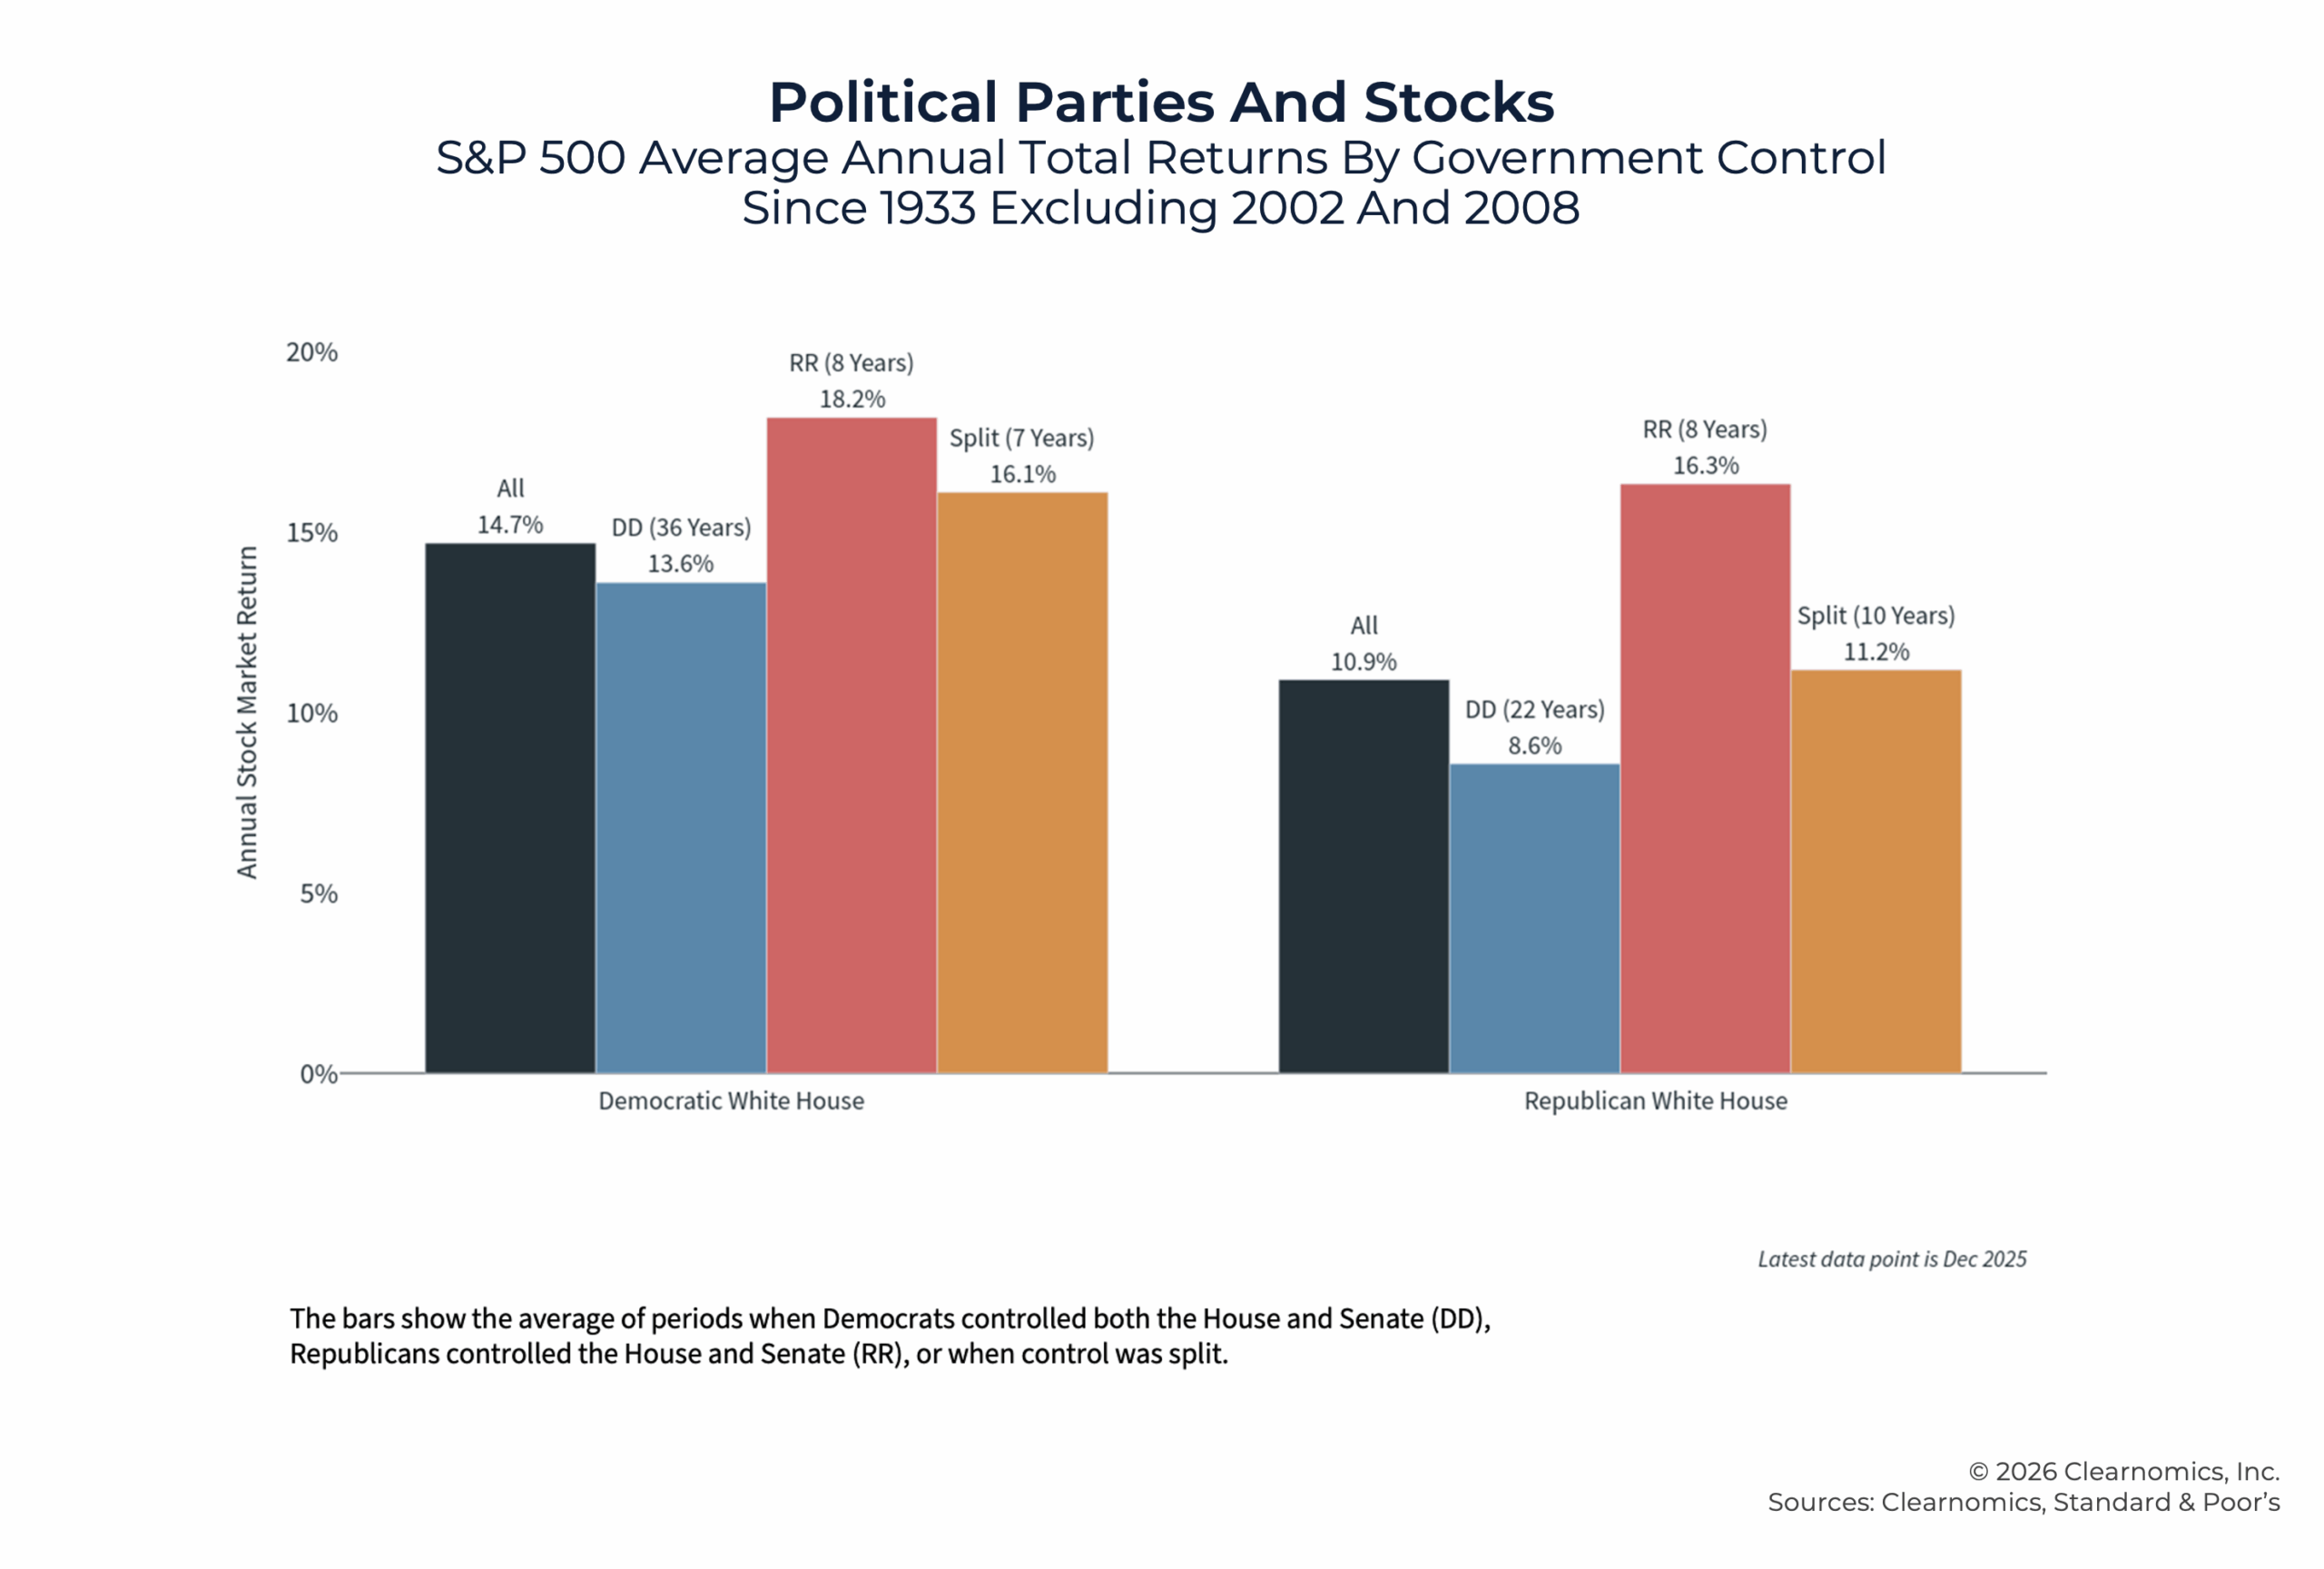
For clients, a recurring concern is the level of the federal deficit and its impact on the national debt. Total federal debt now stands at over 120% of GDP and few long-term solutions have been put forth by either political party. Left unchecked, rising interest costs will continue to consume a growing share of the federal budget, and both parties will face pressure to address this challenge regardless of which one controls Congress. While many investors have legitimate concerns about these issues, the reality is that fiscal worries have existed for decades without derailing markets. In fact, investing based on the size of the deficit would have resulted in the wrong investment decisions, partly because deficits tend to be the highest when markets are the cheapest.
Here are some key talking points for election discussions in the second half of the year:
- Since 1933, the S&P 500 has averaged annual total returns of 8.6% during midterm election years. This demonstrates that markets continue to advance even during periods of political transition and uncertainty.
- Historical data shows that when midterm years produced negative returns, the causes were economic in nature, including recessions, aggressive monetary tightening, or financial crises, rather than the elections themselves.
- Political headlines can create short-term volatility, and the weeks surrounding an election may bring elevated market swings. These moves have historically been temporary, with markets returning to longer-term trends once the outcome is known.
- The national debt and federal deficit are legitimate long-term concerns, but investors who have reduced equity exposure based on fiscal fears over the past two decades have consistently missed out on significant market gains.
While politics are important to citizens and taxpayers, what primarily drives markets over time is corporate earnings growth, economic fundamentals, and the business cycle. The most reliable path forward is to focus on what can be controlled, including asset allocation, tax strategy, and a sound financial plan, rather than positioning portfolios based on political predictions that are, by their nature, uncertain.
6. Artificial Intelligence: From Infrastructure To Adoption
For several years now, large technology companies have invested heavily in AI infrastructure, including data centers, semiconductors, and energy. This is partly due to the promise of these technologies, but is also driven by the desire for growth and the sizable cash stockpiles these companies hold. The market is now trying to determine whether these investments will generate sufficient returns. This transition is not unique to AI, but is instead a pattern that has repeated throughout history as innovation occurs.
The internet boom of the 1990s is the most recent and obvious parallel, since it both demonstrates the long-term impact of a transformative technology, and also the tendency of markets to overestimate the speed at which profits will grow. While there was significant enthusiasm for dot-com companies back then, the true winners, which became today's largest technology companies, took decades to build. At the same time, disruption within the technology sector has widened. Some software companies have faced questions about whether AI could disrupt their existing business models, a debate that affected markets earlier this year but has faded somewhat. These same dynamics will likely continue through the second half of the year.
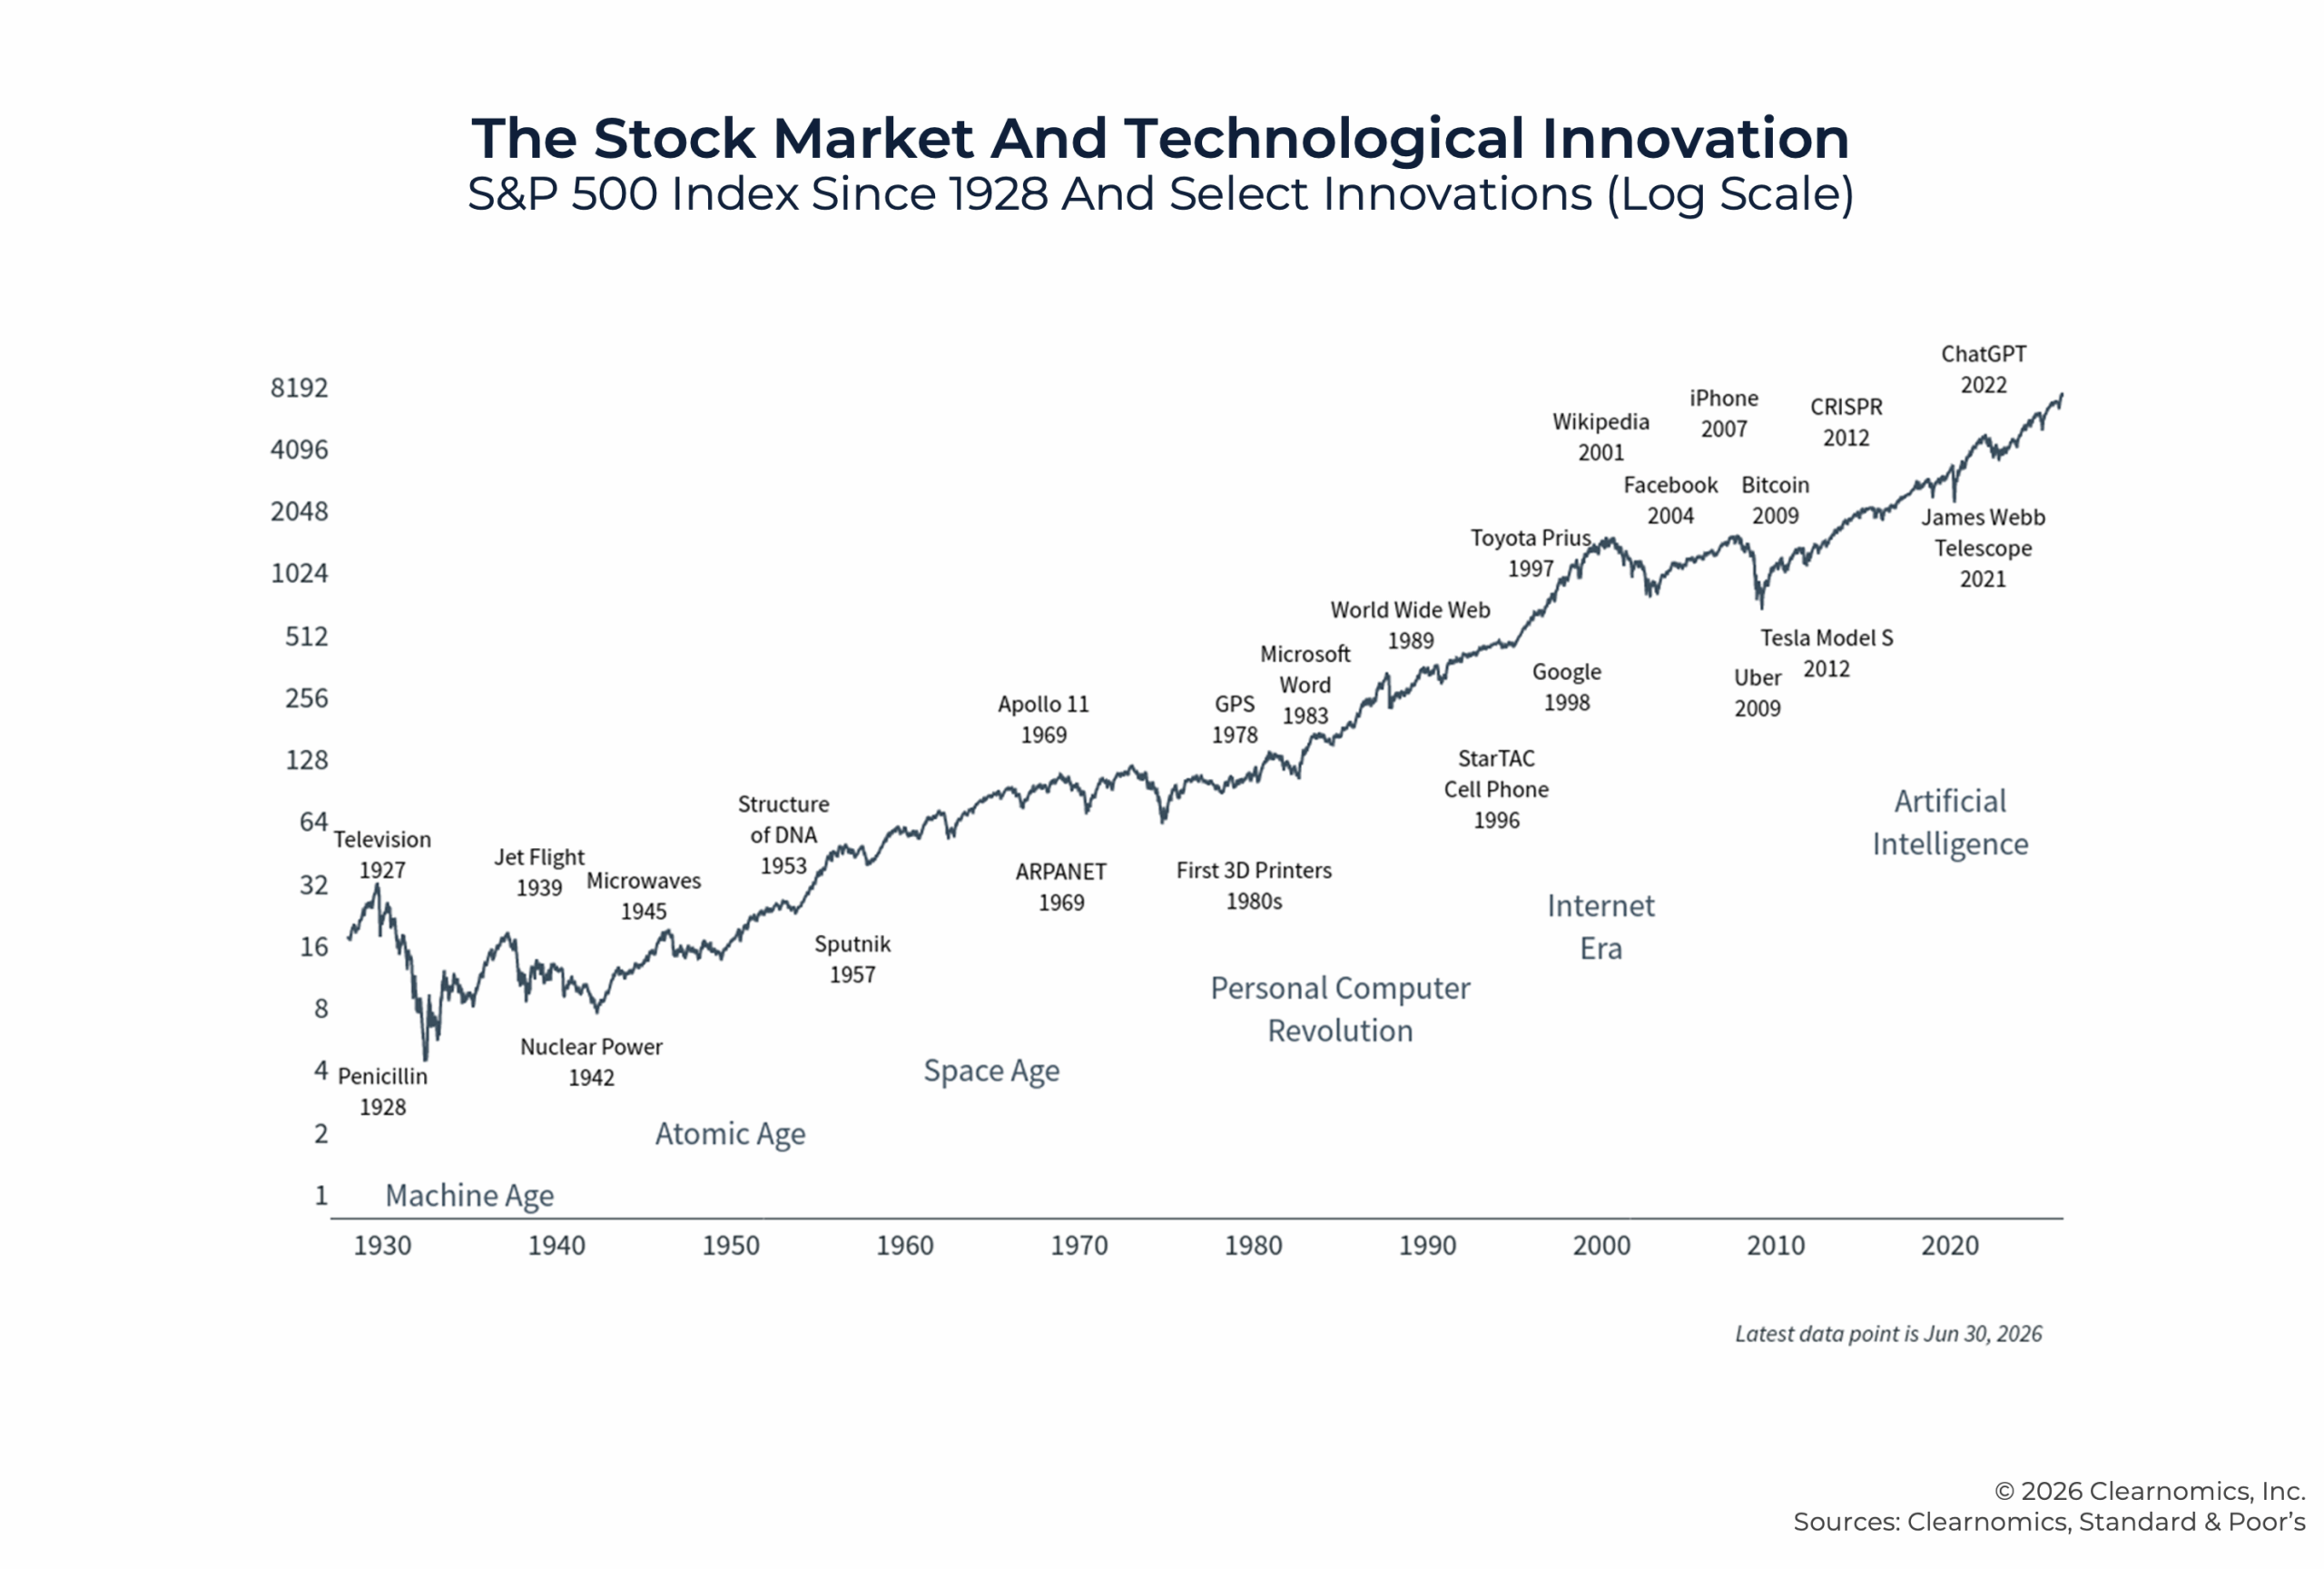
To support client conversations around AI, these points can help provide perspective:
- The Magnificent 7 (which consists of Alphabet, Amazon, Apple, Meta, Microsoft, Nvidia, and Tesla) returned over 300% from the start of 2023 to the end of the second quarter, compared to 92% for the S&P 500 over the same period.
- Since the Magnificent 7 now represent over 35% of the S&P 500, nearly all investors have exposure whether they are aware of it or not. This concentration of technology-led growth has benefited many portfolios, but it also means that shifts in AI sentiment can have an outsized impact on broad market indices.
- The S&P 500 Information Technology sector has a year-to-date return of 19.8% through June, reflecting continued investor confidence in AI-driven earnings growth. However, the sector's forward price-to-earnings ratio of 22.8x reflects elevated expectations, which leaves limited room for disappointment if earnings fall short.
One of the biggest questions around AI is whether the current rate of investment in data centers is sustainable, especially if large language models become more efficient. The Jevons Paradox is a commonly cited way to frame this discussion. It states that greater efficiency in the use of a resource often leads to greater total consumption of that resource, not less. If the cost of AI usage falls, demand for these capabilities from new applications may ultimately increase, and powerful models that are cheaper and smaller to operate could be used in a wider variety of devices. This is the main driver of the current pace of capital spending by companies as they build out data center capacity to get ahead of this demand.
Why does this matter for clients? The key lesson from prior technology cycles is that broad diversification that balances growth and risk management has served investors well, especially when it comes to transformative technologies. The companies that dominated the infrastructure phase of past revolutions were not always the ones that generated the greatest long-run returns. Even when they were, it took decades to fully reach the scale investors anticipated. Maintaining exposure to AI-related growth while keeping portfolios balanced across sectors and asset classes remains the best approach for investors with long time horizons.
7. Short Periods Of Macro-Driven Volatility
One of the defining characteristics of the first half of 2026 has been the pattern of sharp, macro-driven swings followed by recoveries. Investors experienced this during the Venezuela conflict in January and again in February when the Iran conflict began. This is similar to last year's tariff-driven volatility and subsequent rebound. In each of these cases, the VIX index of stock market volatility spiked before retreating, and the S&P 500 experienced day-to-day swings that proved to be short-lived.
Perhaps the most important risk for investors navigating these episodes is not the volatility itself, but the behavioral response they can trigger. Investors who try to time the market often do so once the event has already occurred, and often near market lows. The events of the past few years show how quickly markets can rebound, often in unexpected ways. This means that trying to react to events can have unintended consequences, and historically investors who remained invested fared better.
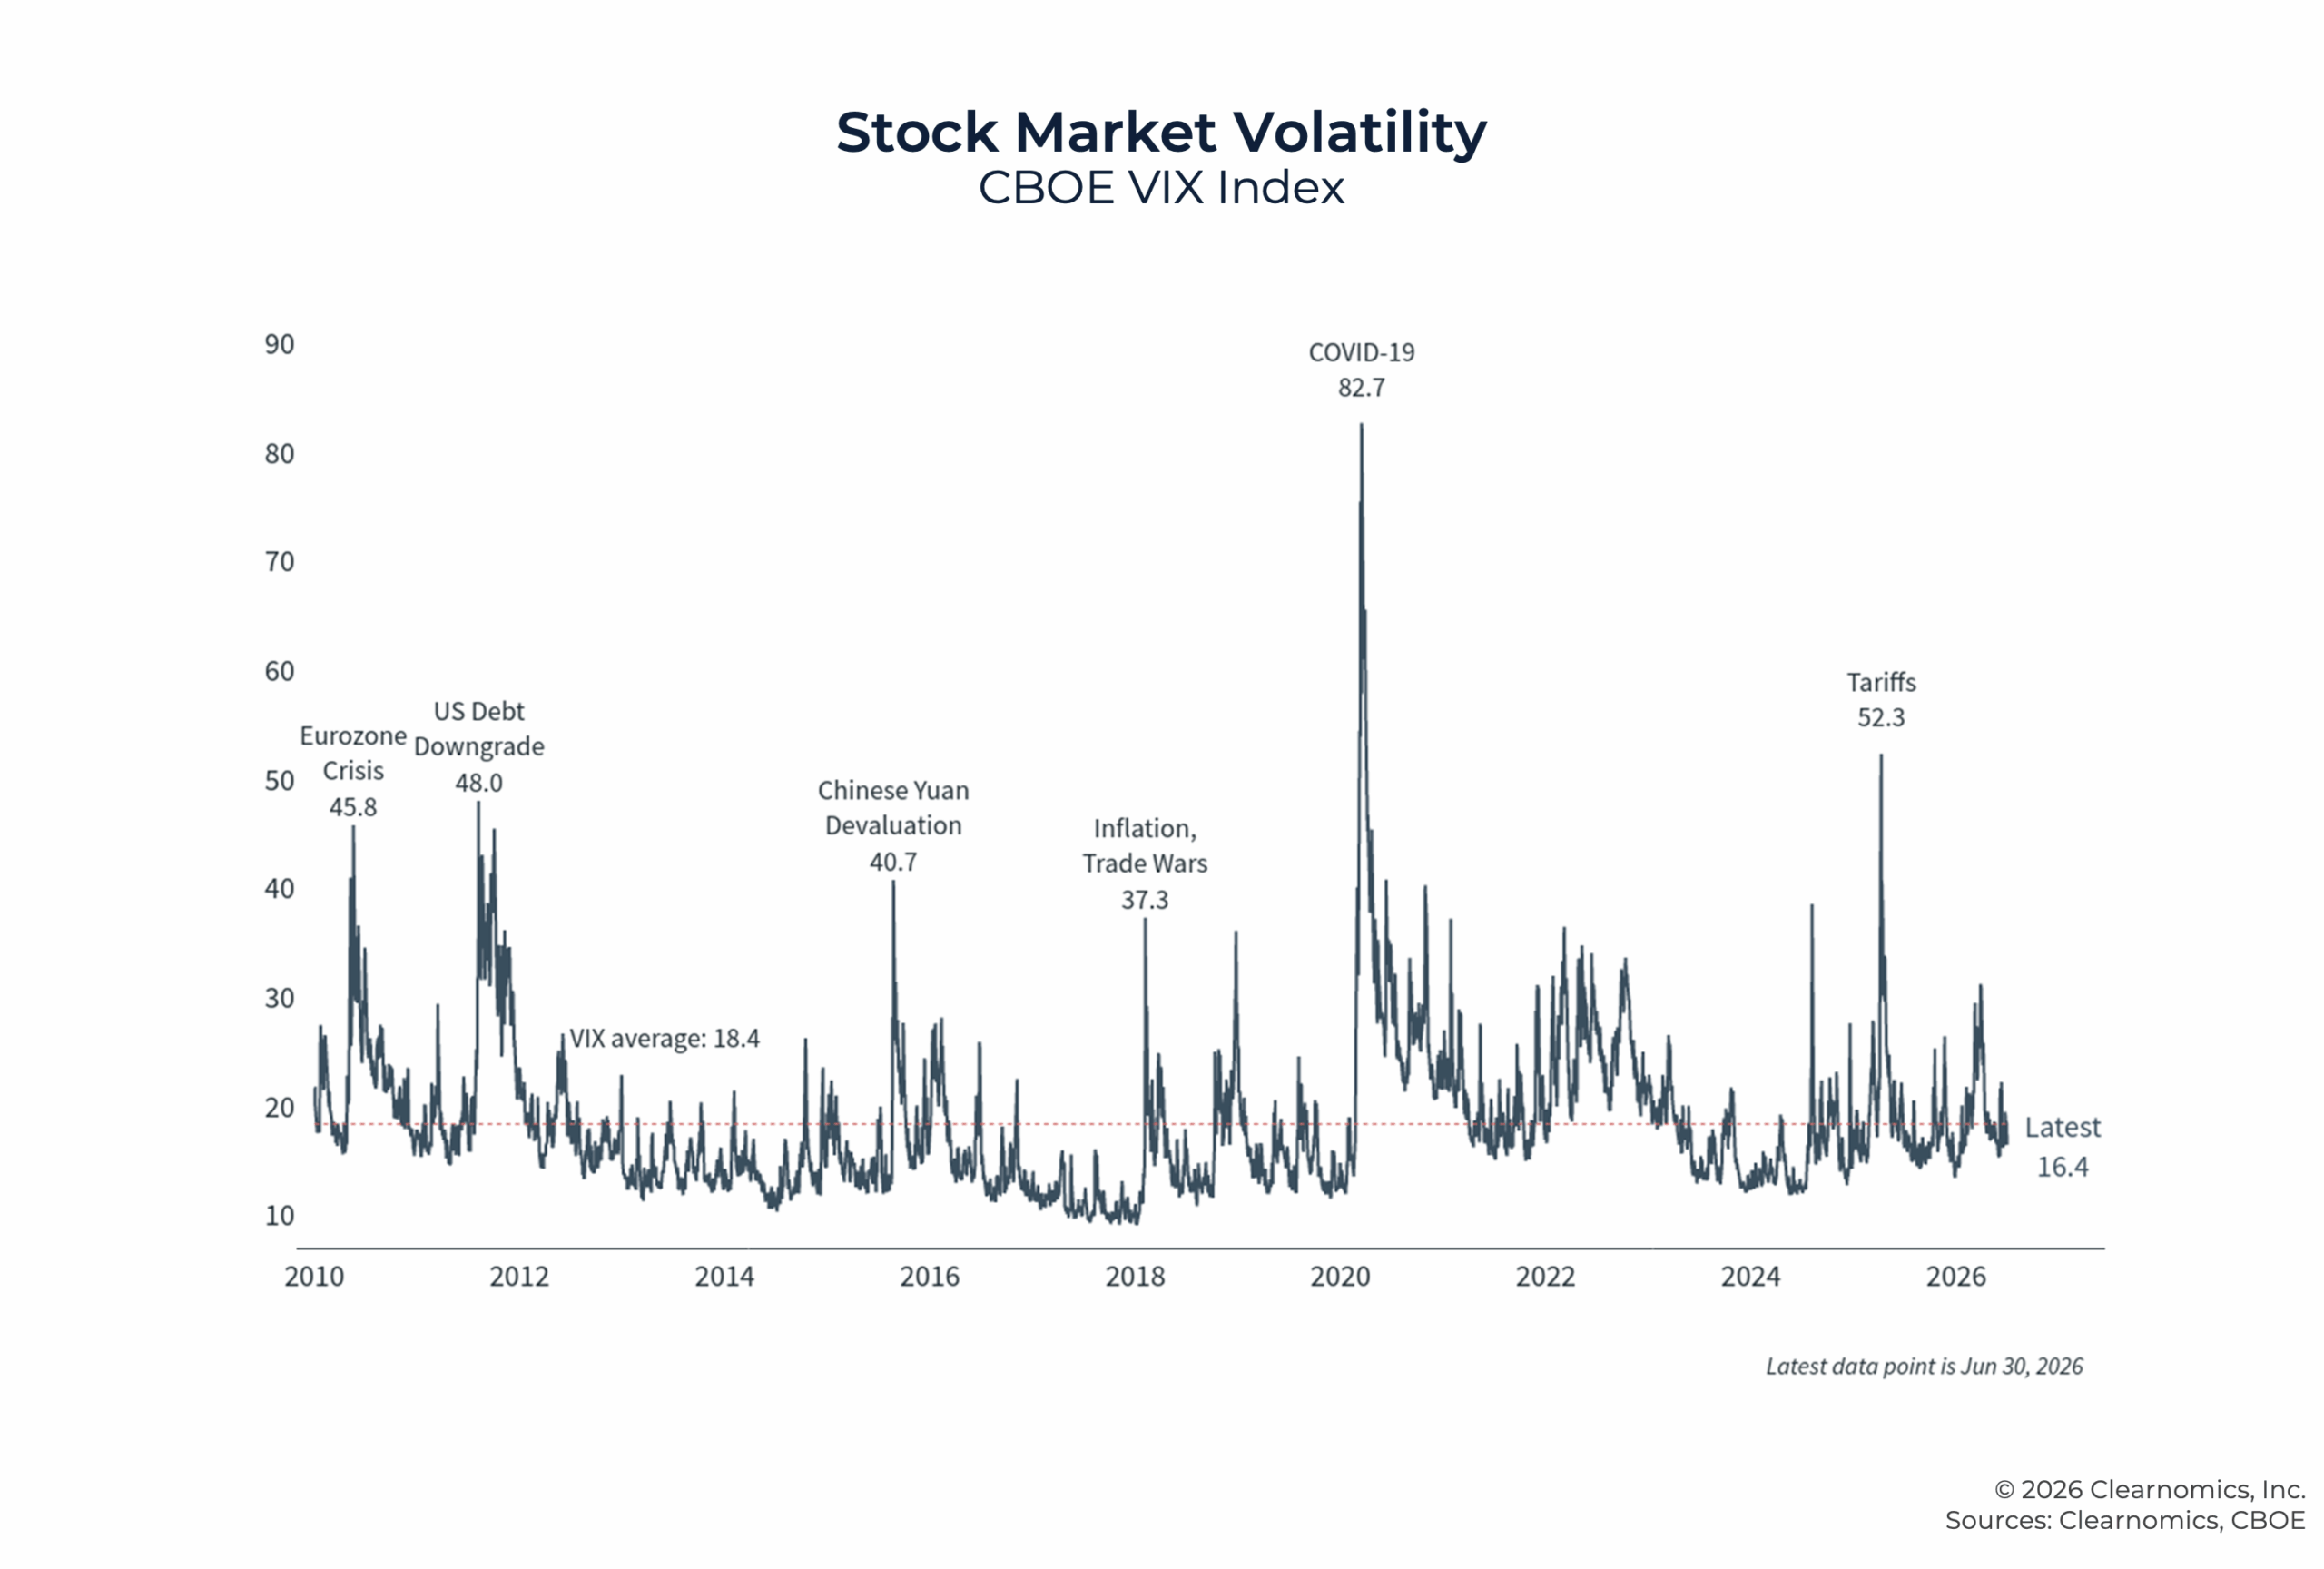
Key points for client conversations:
- The S&P 500's maximum intra-year drawdown in 2026 has been approximately 9%, which is below the historical average of around 15% per year since 1980. The year has felt volatile, but the actual pullbacks have been modest by historical standards. Periods with uncomfortable headlines have frequently ended with positive full-year returns.
- The current VIX reading of 17.3 sits slightly below the long-term average of 18.4, suggesting that markets have absorbed a significant amount of uncertainty without a lasting deterioration in sentiment. For long-term investors, this is an important distinction: elevated uncertainty does not always translate into sustained market damage.
- Each episode of macro-driven volatility this year, whether driven by oil prices, inflation data, or Fed policy uncertainty, has resolved within weeks rather than months. This reinforces the importance of not making long-term portfolio changes in response to short-term events.
- Dollar-cost averaging, the practice of investing a fixed amount on a regular schedule rather than waiting for a perceived optimal entry point, can be effective for maintaining investment discipline during market volatility. Investors who waited on the sidelines for a better entry point have often missed a part of the recovery.
8. The Labor Market Has Strengthened
When it comes to understanding both the overall economy and the financial health of households, nothing is more important than labor market data. In fact, it is rare to have recessions without a jump in the unemployment rate, and vice versa. Over the past year, the job market has been mixed but appears to be improving. The average monthly payroll gain in 2025 was only 10,000 per month on average, after adjusting for the annual revisions from the Bureau of Labor Statistics. Job openings also declined last year, reflecting economic caution, partly around tariffs and AI. Despite this, unemployment remained low due to a slower rate of immigration and other demographic trends.
This pattern has shifted this year with payroll gains accelerating to an average of about 111,000 per month from April to June. While the latest numbers were lower than economists expected, this is still a positive sign for consumers and businesses. This recovery also matters because it directly affects one of the Fed's two mandates. Earlier in the year, the combination of elevated inflation and a weakening jobs market presented the Fed with a difficult balancing act as it considered the path of monetary policy.
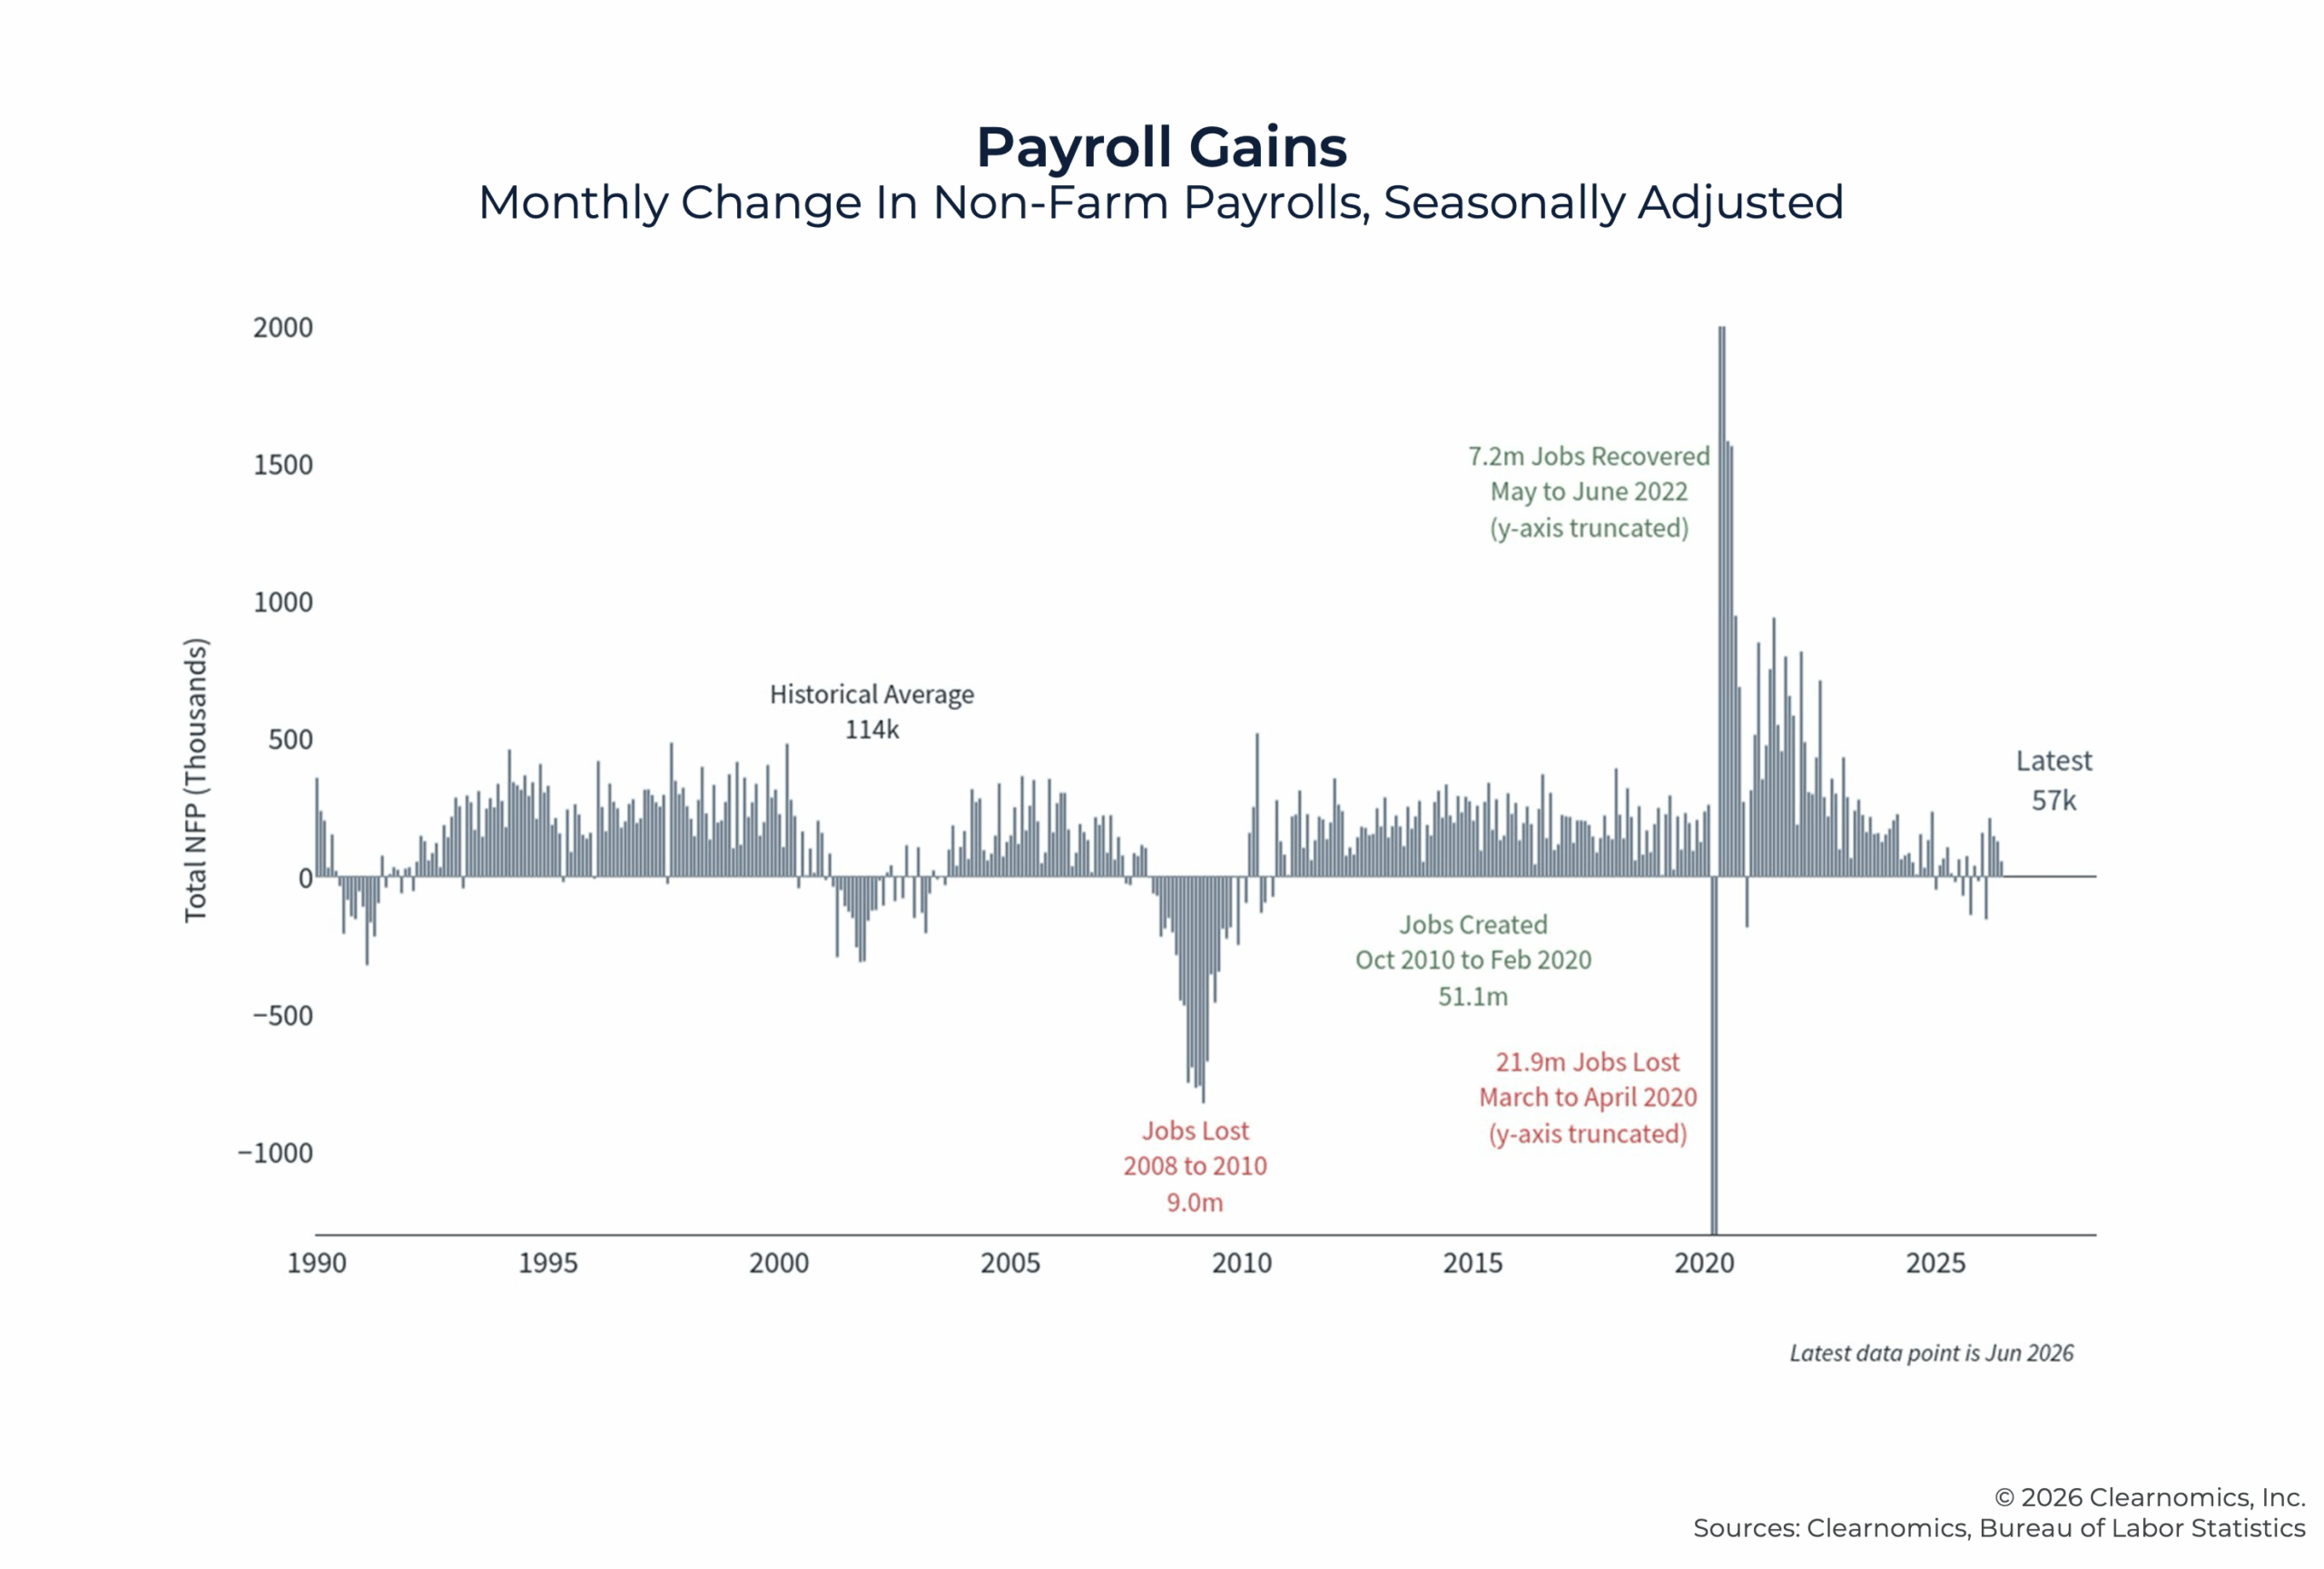
Here is the latest data on the state of the labor market:
- Non-farm payrolls grew by 57,000 in June, below the consensus expectations of 113,000 but still an improvement from the prior year. While this is a deceleration from previous months, which were also revised lower, a three-month moving average of 111,000 is still healthy.
- The unemployment rate fell to 4.2%, well below its long-run historical average of 5.9% since 1960. For historical context, unemployment rose to 10.0% during the 2008 financial crisis and to 14.8% during the 2020 pandemic.
- Wage growth of 3.5% year-over-year is below headline inflation, but continues to outpace core inflation. This is an improvement from the period when inflation was consistently running well above wages and eroding real incomes.
- Job openings at 7.6 million increased in June and remain above the historical average of 5.5 million. This suggests that companies are beginning to hire again after several months of caution.
- The labor force participation rate at 61.5% continues to fall, reflecting structural demographic pressures from an aging population and lower immigration. This means the labor market can remain relatively tight even with moderate payroll growth, since the available pool of workers is not growing as quickly.
For clients, a healthy labor market is one of the most important pillars supporting the broader economy and, by extension, investor portfolios. Employment data connects directly to household income, consumer confidence, and spending decisions, all of which flow through to corporate revenues and earnings growth.
9. High Interest Rates Create Bond Market Opportunities
Interest rates remain elevated across all maturities of the U.S. Treasury yield curve, a fact that has important implications for both bond and equity investors. The 10-year Treasury yield stands at 4.38% and the 2-year yield at 4.07%, both higher than many investors expected at the start of the year. This also means that borrowing costs, including mortgage rates, are higher than many businesses and consumers would like.
For bond investors, the current rate environment is among the most attractive we've experienced in the decades following the global financial crisis. The Bloomberg U.S. Aggregate Bond Index yields 4.7%, compared to its average of 3.0% since 2009. Investment-grade corporate bonds yield 5.1%, above their long-term average of 3.8%. Even the Bloomberg U.S. Treasury Index yields 4.3%, compared to a 2.2% average over the same period. These elevated yields provide genuine income to bond investors and restore fixed income to its traditional role as a portfolio stabilizer and income generator.
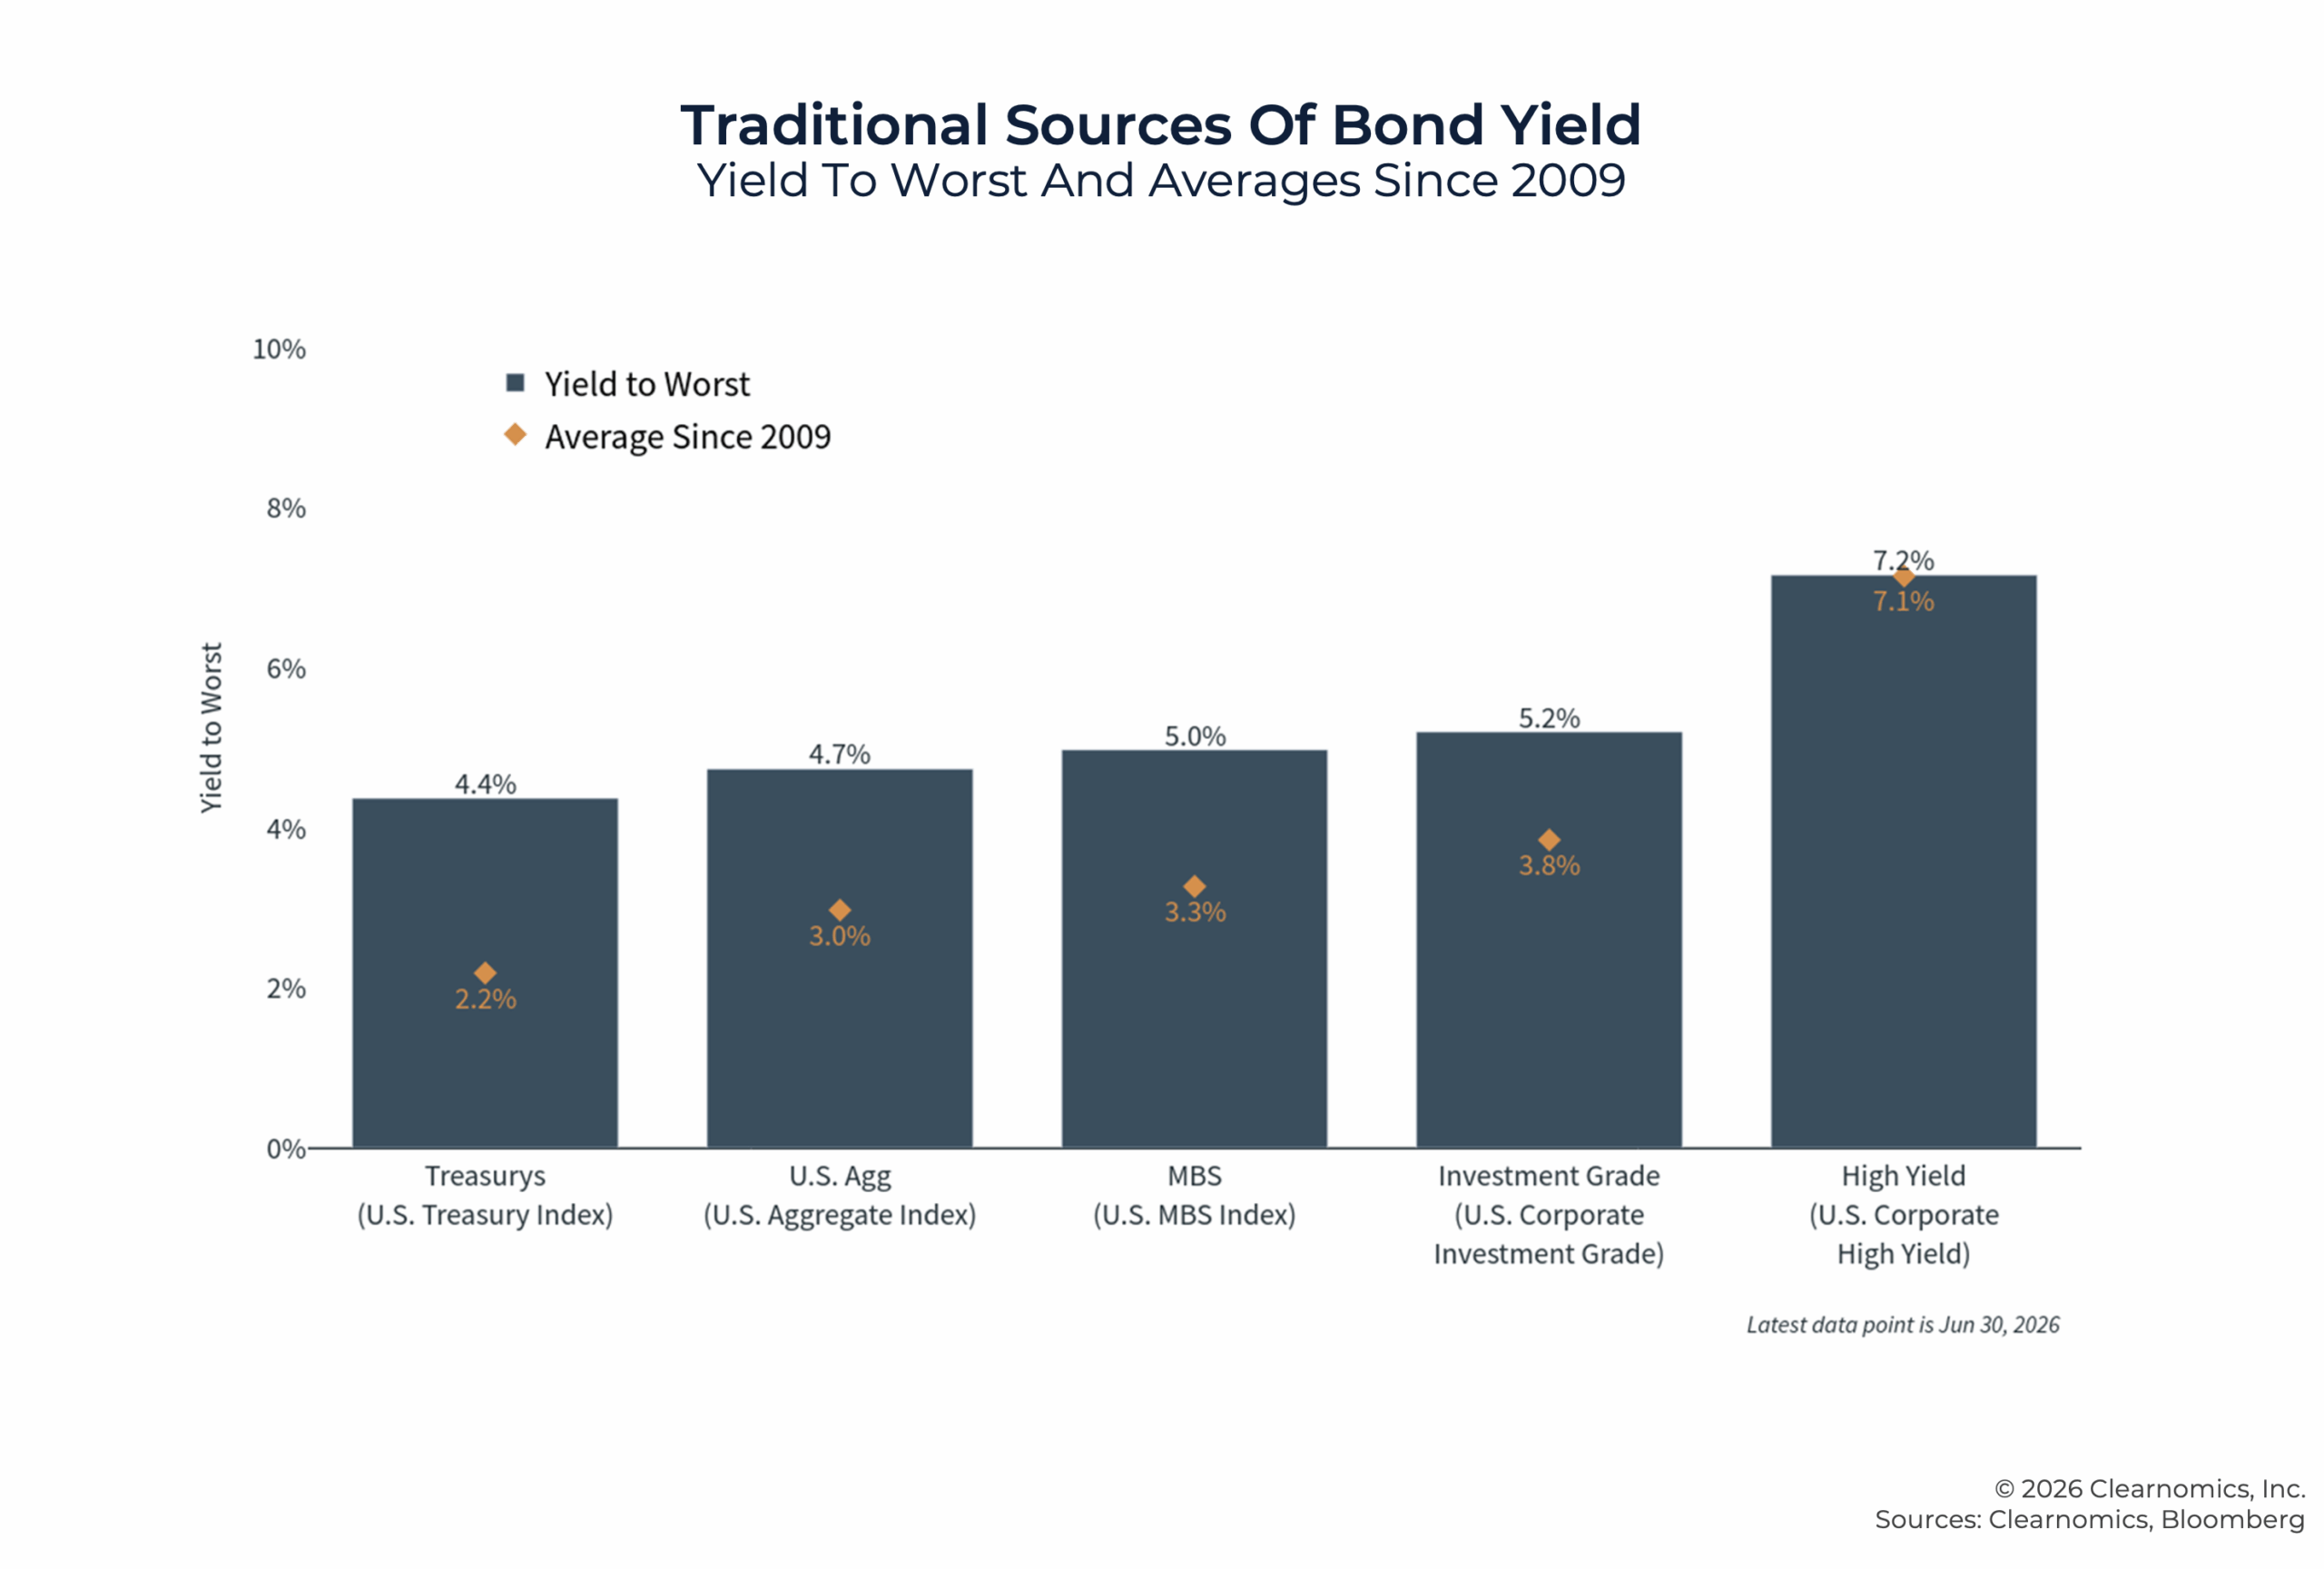
For equity investors, higher rates are typically more challenging, since they increase the attractiveness of bonds as an alternative and raise the discount rate applied to future earnings. This is perhaps one reason why the S&P 500 forward price-to-earnings ratio of 20.0x, while elevated, has not expanded further this year despite strong earnings growth. The 30-year Treasury yield at 4.87% also affects long-term borrowing costs for businesses and consumers, including mortgage rates, which remain above 6%.
Here are some facts on interest rates and bond markets:
- Bond yields across all major fixed income sectors are currently above their averages since 2009.
- Bond returns have been relatively subdued as rates have increased. The Bloomberg U.S. Aggregate Bond Index is up just 0.8% in 2026, although bonds have supported investors during bouts of market volatility. The Bloomberg U.S Treasury Index is relatively flat, up 0.5% this year.
- The yield curve has returned to a positive slope for the first time in several years, with the 10-year Treasury yield above the 2-year. While the current spread of 31 basis points is below the historical average of 84 basis points, the return to a positive slope is a constructive development that historically has been associated with stable or improving economic conditions.
- High-yield corporate bonds yield 7.2% as of late June 2026, just above their long-term average of 7.1%. Spreads remain relatively tight, suggesting that credit markets are not pricing in a significant increase in default risk, even as higher borrowing costs have added pressure to some leveraged borrowers.
For investors who have been holding excess cash while waiting for rate certainty, the current environment potentially offers an opportunity to put that cash to work into fixed income with a healthy yield.
10. Cash On The Sidelines
A natural reaction to stock market volatility is to shift to cash. High interest rates over the past several years also encouraged this behavior, since higher yields on cash and short-term bonds create an incentive to hold these assets compared to riskier stocks and bonds. For instance, money market fund assets began rising in 2022 as the Fed began to raise rates, and have reached record levels around $7.9 trillion. While cash serves an important purpose in any portfolio and financial plan, this should not come at the expense of a balanced portfolio.
The core challenge with cash as a long-term holding is that its returns, while positive on paper, fail to outpace inflation in the long run. For example, a $100,000 investment in six-month Certificates of Deposit currently generates approximately $1,650 in annual interest income, based on FDIC data. Not only is this well below the long-run average of $3,152, but the real income from cash is negative after adjusting for inflation. Even in cases where investors can find higher yields on cash instruments, these are usually short-term by their very nature. This creates what investors often refer to as "reinvestment risk", since investors must decide how to invest that cash going forward upon the maturity of those short-term instruments.
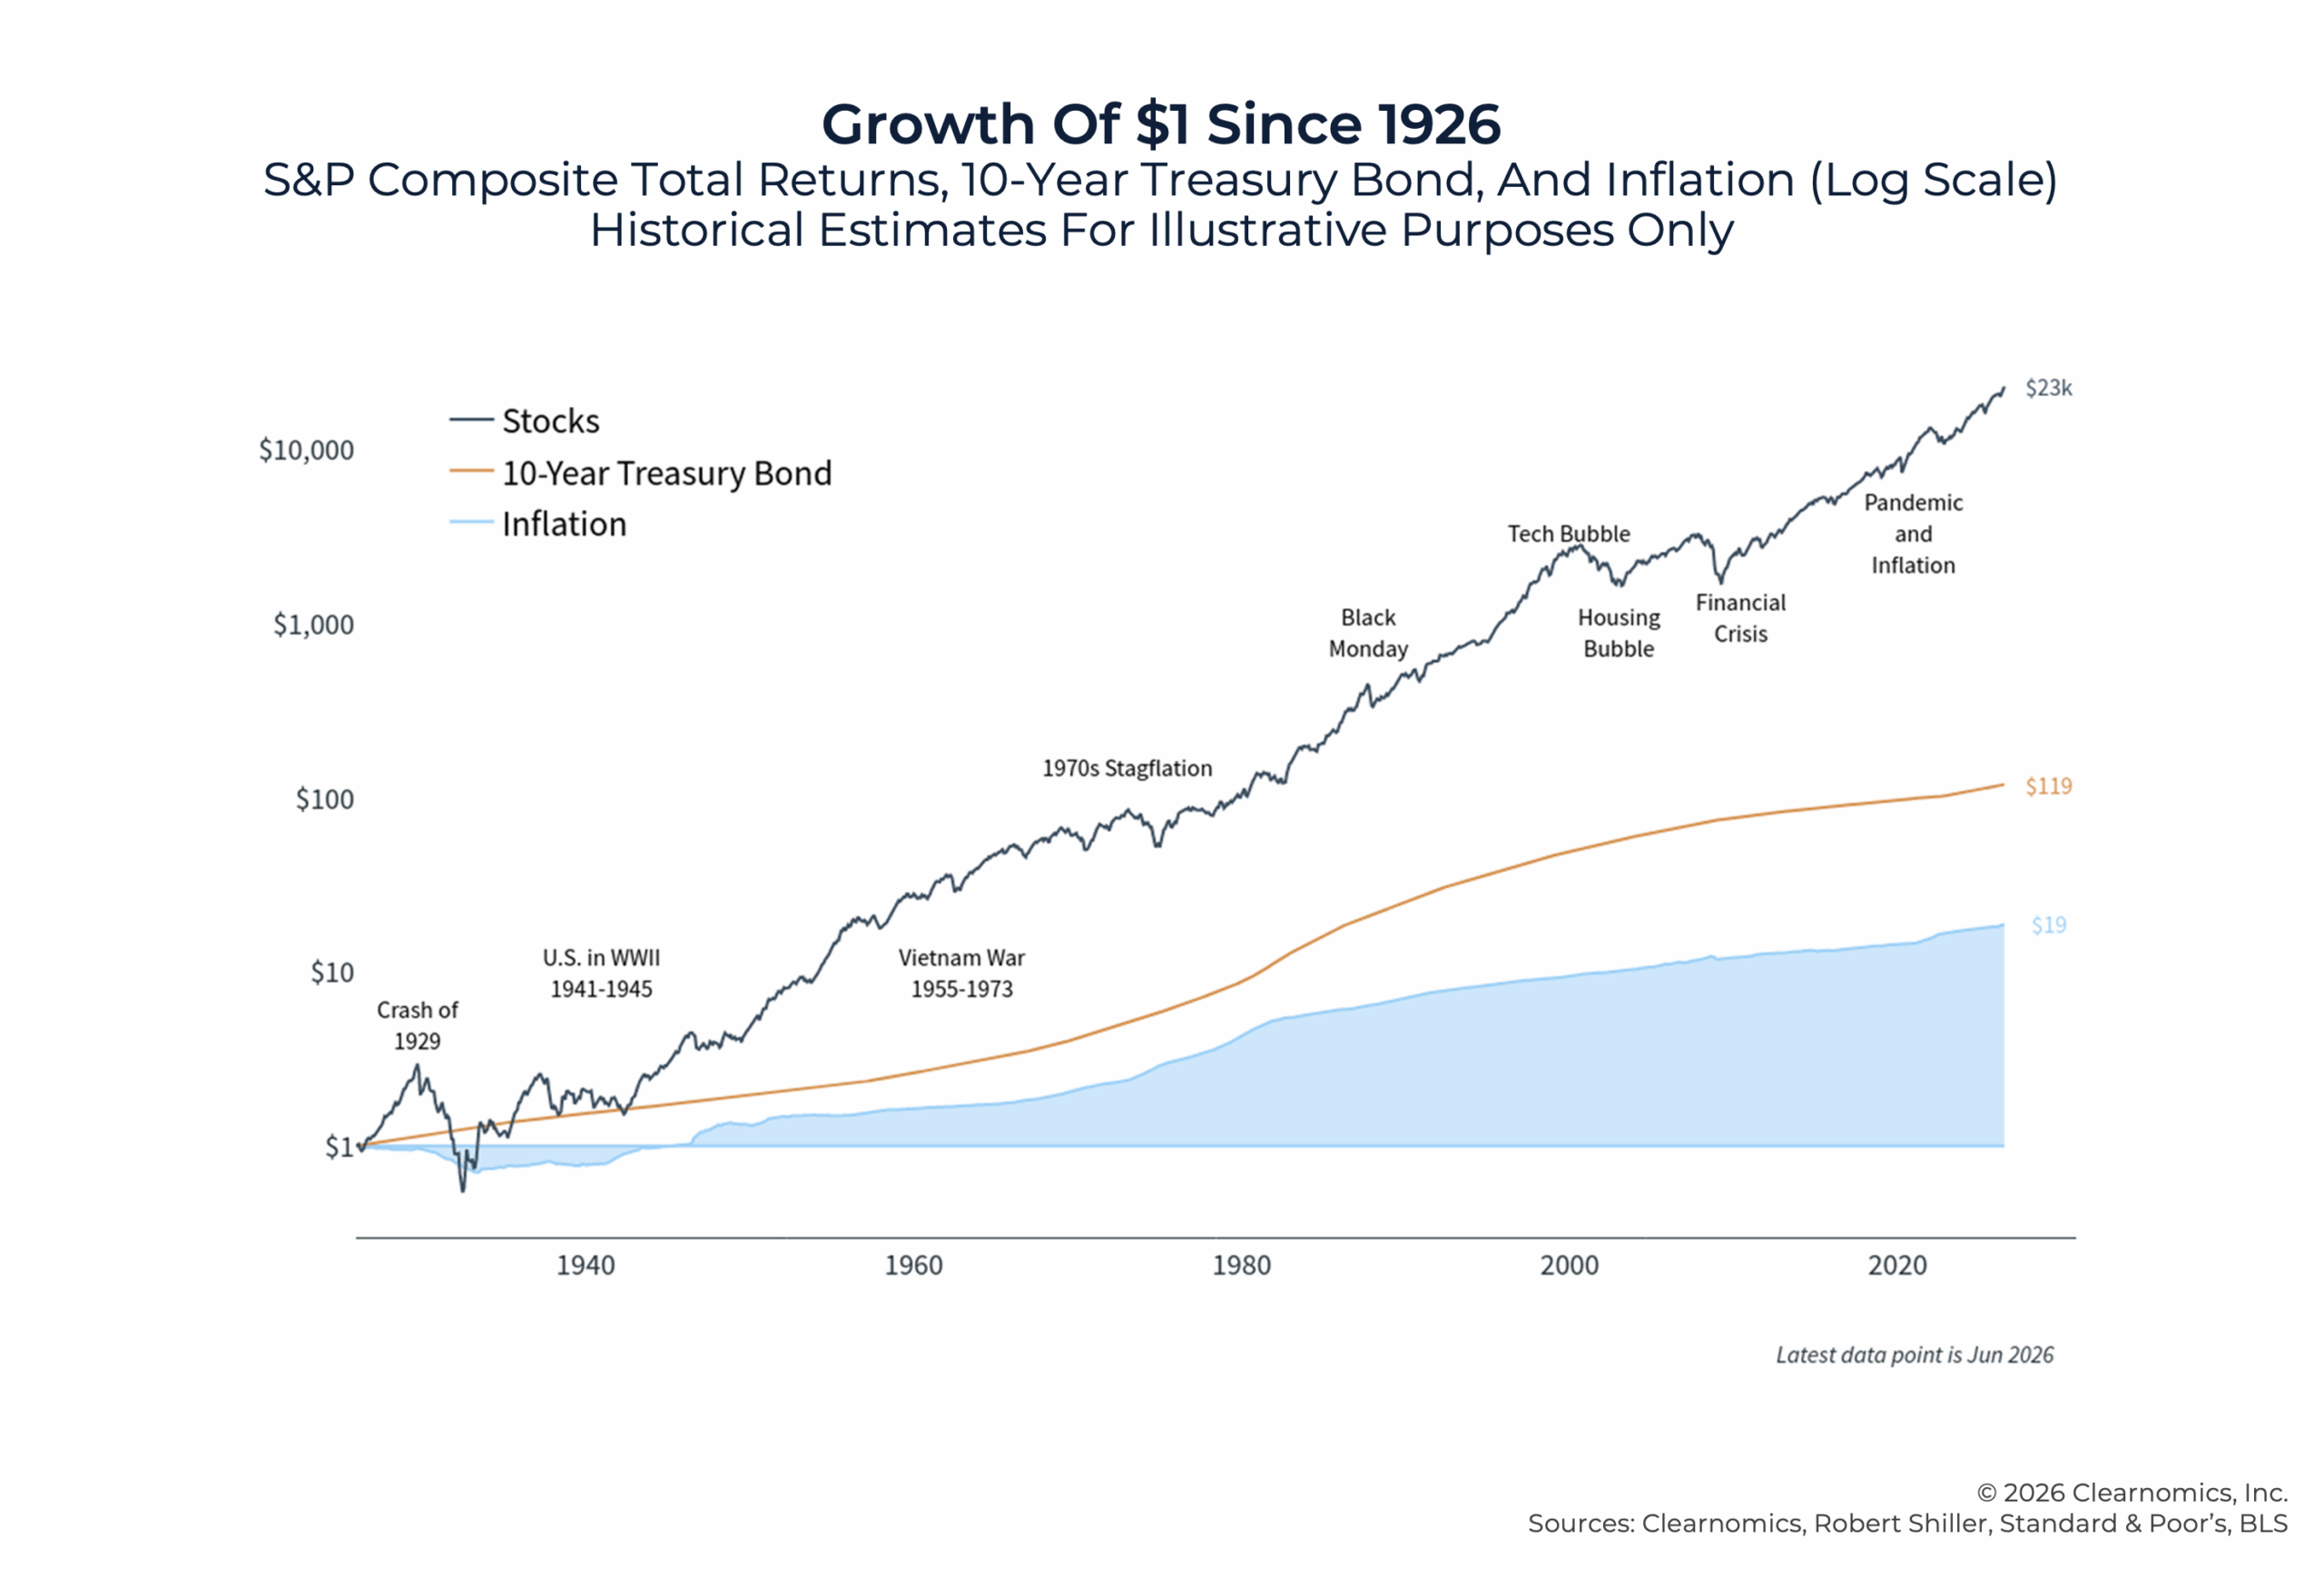
So while cash may feel safe on paper, the opportunity cost of holding excess cash relative to stocks and bonds over long periods can be substantial. As shown in the accompanying chart, $1 invested in the U.S. stock market in 1926 would have grown to approximately $22,000 today. A similar investment in long-term bonds would be worth roughly $119. Both of these have outpaced inflation – costs increased from $1 to $19 over this same period.
For clients with cash on the sidelines, here are some considerations:
-
- Money market fund assets have reached a record $7.8 trillion, more than double their pre-pandemic level when interest rates were near zero. Much of this cash represents dry powder that has yet to be deployed into longer-term investments.
- The real income from cash, after adjusting for current inflation, is currently negative. Even though nominal yields on money market funds and short-term CDs appear attractive, they are not keeping pace with the current inflation rate of 4.2%, meaning the purchasing power of cash holdings is declining on average.
- For investors with cash that is not needed for near-term expenses or as an emergency fund, historical evidence strongly favors deploying it into a diversified portfolio of stocks and bonds rather than allowing it to sit in low-yielding instruments.
Ultimately, the decision about how much cash to hold should be driven by financial planning needs, not by short-term market uncertainty. An appropriate emergency fund, reserves for known near-term expenses, and liquidity for planned financial goals are all legitimate reasons to hold cash. Beyond those purposes, however, the historical evidence is clear: staying invested in a diversified portfolio of stocks and bonds has consistently outperformed holding excess cash over longer time periods.
The Importance Of Providing Clients With Perspective
The first half of 2026 is a reminder of the importance of staying invested and following long-term trends. The second half of the year will undoubtedly bring new concerns, especially as the midterm election heats up.
However, what history consistently shows is that investors who stay diversified, maintain appropriate asset allocations, and focus on long-term financial goals have been rewarded more reliably than those who try to time the market. For financial advisors, the mid-year point is an opportunity to reinforce these topics in preparation for the coming months.
Advisors who would like to use these visuals can download a PDF copy here. The charts can also be customized with firm branding through the free Clearnomics Community insights platform.