Executive Summary
The third quarter of 2026 saw a historic climb in interest rates, a new Federal Reserve rate hike cycle, and oil prices surging back above $100 a barrel. Given this combination of developments, many investors might have assumed that equity markets would struggle heading into year-end. Yet the S&P 500 notched its 27th record high of the year amidst continued strong corporate earnings, rewarding those who have been able to look past the headlines and remain invested.
In this article, James Liu, CEO of Clearnomics, walks through seven charts to help advisors put the quarter's headlines into context for clients, from the historic climb in bond yields, to what resurgent AI-related spending means for corporate earnings and productivity.
Interest rates have been the biggest story of the quarter, with the 10-year Treasury yield touching 5.30% in September, a level not seen since 2002, while the 30-year reached 5.64%. Unlike 2022, when rates climbed largely due to runaway inflation (hurting stocks and bonds at the same time), today's increases are being driven primarily by rising real (inflation-adjusted) yields – reflecting economic growth and heavy AI-related capital.
Inflation remains part of the picture as well, with headline CPI at 3.4% year-over-year and core CPI at 2.4%, both still driven largely by oil prices. This gave the Fed room to raise its target rate to a range of 3.75% to 4.00% in September – its first hike in three years – though new Fed Chair Kevin Warsh has also signaled a preference for stepping back from the central bank's traditional practice of forward guidance.
Corporate earnings, meanwhile, have been equally strong this quarter. S&P 500 earnings grew approximately 29% year-over-year, a third consecutive quarter of growth above 25% and well ahead of the historical average of around 8%, with all 11 S&P 500 sectors posting gains rather than returns being concentrated in a handful of mega-cap technology names.
Oil and copper were also in focus this quarter, with Brent crude climbing back above $100 a barrel amidst continued disruptions near the Strait of Hormuz, and copper rallying to all-time highs on surging demand tied to AI data centers.
With the midterm elections approaching in November, clients may naturally wonder whether a shift in Congressional control could affect their portfolios. History, though, suggests that markets have advanced under virtually every combination of political leadership over the past century, and that corporate earnings, interest rates, and other long-term trends are a far stronger indicator of market performance than one party or the other having political control.
Anticipated public offerings from AI leaders such as OpenAI and Anthropic have kept investors focused on a familiar question: whether today's level of AI infrastructure spending will eventually be matched by real productivity gains. And although equity market breadth has declined in recent months, a wide range of asset classes are positive year-to-date – an opportunity for advisors to demonstrate the value of a well-diversified portfolio throughout an eventful year.
Ultimately, the key point is that underlying fundamentals, such as real economic growth and broad-based earnings strength, are what typically drive long-run returns, even amidst headlines about rates, the Fed, and oil.
 |
And if you want to go deeper on this topic, hear directly from the author on the Financial Advisor Technician podcast. |

Listen To The Financial Advisor Technician Podcast On This Topic




Episode Shownotes And Transcript
Click to expand transcript and show notes↓↓
Title: Putting Economic And Q3 Market Headlines Into Context For Clients
Shownotes:
Full Transcript:
Adam: Hello, and welcome back to the "Financial Advisor Technician" podcast. I'm your host, Adam Van Deusen. On today's episode, we're going to discuss the current market environment and how advisors can address common client concerns. Because while clients might be investing for the long term, it's hard for them to miss the latest financial headlines, from rising bond yields and interest rates to elevated oil prices, which offers advisors the opportunity to demonstrate their expertise, build client confidence, and ultimately help clients stay on track to meet their investment goals by being prepared to address these questions and put the latest macroeconomic activity into context.
To help us dig deeper into this topic, I'm joined today by James Liu, the founder and CEO of advisor data and insights company Clearnomics, to discuss the key issues that drove market performance during the recently ended third quarter and what events could move the market in Q4. So welcome, James, and thanks for joining us here on the Financial Advisor Technician podcast.
James: Adam, thanks for having me.
Rising Bond Yields And What They Mean For Client Portfolios [1:15]
Adam: So, to start, a major issue this quarter was the continuing rise in bond yields. Perhaps you could start by putting the current state of bond yields into historical context and maybe discuss what this means for financial planning clients in practical terms.
James: Well, Adam, that's a great point on bond yields. And what happened in the third quarter could really play out again in the fourth quarter. And so, what we're seeing today for those advisors who may have seen headlines but haven't dug deep into it is a complete reversal of the rate environment that we've seen over the last 20 years.
So, for example, over the last 15 years, we've had interest rates that have been exceptionally low. And that only reversed after the pandemic, when we had high inflation and the Fed pushing rates higher. And what we've seen over the last year or so is that those rates have not only stayed high, but they've gone higher from there.
So, today, whether you're talking about the five-year yield, the 10-year, the 30-year Treasury, all of those yields are near 20-year highs. We can talk about the specific factors driving those. There are several of those that we'll get into, I'm sure, in a few minutes. But I think the ultimate point for advisors when they work with their clients is that the playbook for dealing with an ultra-low environment after 2008 is very different from what we're seeing today.
And so, what factors are driving those rates higher? Well, it's oil and inflation, especially with the war in Iran continuing. It's the fact that the Fed is now hiking rates. And that's something we haven't seen in about three years. It's the fact that we have steady economic growth. And it's also concerns around the national debt and the federal deficit.
So all these different themes, there are themes happening in the background here in the markets. They're things that clients are seeing headlines around. But I think it's important to help put all that in perspective so that clients can really understand what's driving these rates higher in the headlines that they're seeing every day.
Adam: And then, I guess thinking of the historical context, as you mentioned, it's been quite a long time since we've seen yields this high. But looking at the broader, maybe decades term, where do the current bond yields sort of sit in this context?
James: So bond yields are near multi-decade highs right now. These are yields that were very common in the 1990s and the very early 2000s before the 2008 global financial crisis. But since then, these yields basically are much higher than what we saw after that period. And so, when investors think about this, it doesn't just affect markets. It affects all aspects of their financial lives.
So when you think about interest rates, not only do interest rates reflect what's happening in the economy and the financial system, but they then feed back into the system as well. So, for example, if you think about household balance sheets, not only does it affect the liability side with interest rates on personal loans, credit cards. Right now, the 30-year mortgage rate is around seven percent, but it also affects the asset side as well with savings rates, cash yields, and how you want to allocate to that bond portfolio.
So, if we think about this year, for instance, what you have is a situation where you have stocks near all-time highs. Now, normally, you would think that interest rates being high would be bad for stocks, but that's because interest rates aren't just high because of inflation as they were in, say, 2022. Interest rates are also high because the economy is doing quite well.
So that's helped to push the stock market higher. But, on the other hand, because interest rates are high, of course, you have bond prices coming down as well. So, when you look at large aggregate bond indexes like the Bloomberg aggregate, you have the overall return being flat to negative so far this year.
So when it goes to looking at portfolios, for instance, what you have to consider is the fact that you have equities doing extremely well. You have bonds which have helped to stabilize portfolios, especially during periods of geopolitical turmoil, but you may not get that return boost that you've seen really over the last 40 years in bonds. And instead, you have an opportunity where bonds can help provide that extra boost of income with rates at these levels.
Adam: Yeah. That's a really interesting point because the experience that clients might have had so far, if they're looking at their portfolio statement, is, as you mentioned, might be flat to, perhaps, a little bit down, depending on what they're invested in. But I think from an advisor's perspective, they're looking at going forward with the higher yields, more income generated.
And I would also imagine, you mentioned the bonds as a buffer, if we ever did have an economic downturn, that gives the bonds a little bit more cushion for bond prices to rise with yields potentially falling in an economic downturn. Whereas if you go back a few years, bonds are at one percent, two percent, something like that, there just wasn't really much room.
The Fed’s Recent Rate Hike And Inflation [5:55]
Adam: So moving on to another topic, you mentioned the Fed's actions before. And recently, we saw the first Fed rate hike recently. Perhaps you could talk about, what is the Fed looking at? What are they reacting to, and how might that affect the market moving towards the end of the year?
James: Well, it's not unusual at all for investors and the market to have their eyes focused on the Fed. But I think it does matter. And it's important to distinguish why the Fed is raising rates. There are situations, let's say back in 2022, so only just a few years ago, where there was this view that the Fed was behind the curve, that there was inflation that was rapidly rising after the pandemic and the Fed was too slow in hiking rates to control it. And I think the important thing to say is that that is really not the situation today. And that is also not how the market views it today.
So, again, if you go back to 2022, you had two different sources of inflation. You had the supply-side disruption because of the pandemic. So that was pushing things like semiconductor prices higher. You also had the invasion of Ukraine by Russia, which pushed oil prices higher. So this double effect on the supply side, which caused inflation.
At the same time, you also had what we call demand-side inflation, which is that there were, of course, all these stimulus checks. There was low interest rates. All of that was propelling the demand side higher as well. So you effectively had this perfect storm that was causing inflation to rapidly affect all parts of the financial system. And the Fed had to jack up rates very quickly.
Now, if you fast-forward to where we are today, that is really not the case. So we have steady economic growth. That's for certain. But, at the same time, you have higher oil prices, but they've been high in a way that's been fairly stable, and the market has been able to adjust to.
And so, the Fed, what's strange is that they would normally be viewed as looking past the high oil price situation because these supply shocks, as we call them, usually economists think of them as temporary. So, we just have to kind of get past this hump in inflation, and everything after that will generally be okay for the economy.
What the Fed is trying to do right now is, well, let's just raise rates a little bit in order to prevent those higher inflation rates from spreading beyond the energy sector into other categories. So that's why the Fed raised rates by 25 basis points in September. That's also why the Fed is expected to raise maybe once more later this year. What we are not seeing in the market or in Fed funds rate expectations is this huge uptick in rate hikes that we saw in 2022.
So the reason to explain all that is because this environment really is different. And so, to the extent there are clients or any investors who are worried about rate hikes because typically rate hikes are seen as being bad for the market and bad for stocks, this is really a different situation that we're in today.
Adam: Very interesting. And there are different inflation measures, sort of the broader CPI measure, but they look at core and super core inflation. Perhaps you could talk about some of the differences in those readings and what they tell about the potential path for prices going forward.
James: Absolutely. I think the key to understand inflation is that, really, economists are just trying to get a gauge of what's happening with prices. And that's different from how we often experience inflation as individuals. So, for us, what matters, and what do we call inflation? Well, it's when you go to the store and egg prices are far higher this week than they were a month ago, or beef or chicken prices, for instance. The everyday necessities that we need. Or if your rent goes up more than you expected this year. Those are the different factors.
So what economists try to measure instead is, well, yes, there are factors that affect specific prices that we all experience, but there is this underlying inflationary trend that is pushing up all prices. And so, what economists try to do is, well, they take a sample or basket of different prices. That's what goes into the consumer price index.
And there's hundreds of different ways you can cut these numbers. For example, right now, you mentioned CPI, for instance. If you take a look at the headline number, the headline number is much higher than most investors and economists would like. The Fed notionally has a two percent target on inflation, and we've been well above that over the past several years. But when you take out energy prices, food prices, and shelter, then what you see is that CPI really is only at two percent.
So, what we're not saying is that food, energy, and shelter are not important and that people don't pay those prices. That's not what we're saying at all. What we are saying is that, well, is there this underlying inflation trend that's pushing all prices higher, and is that beyond categories related to oil prices and the war in Iran? And what the current numbers say is that energy prices are really the reason inflation is higher.
We have oil prices that are still hovering around $100 a barrel, and that has kept energy prices higher, that's pushed gasoline to still around four dollars and 50 cents, on average, per gallon, and that is the underlying driver. And when you look at other categories, yes, inflation may be a little bit higher than we would like, but that's not really what's causing overall inflation and it's not why the Fed is hiking rates today.
Adam: Very interesting. And I should note for our listeners, this has been a great conversation, but if you are perhaps more visually inclined, James has written a wonderful article for the "Nerd's Eye View" blog that includes several charts that might be helpful for you to put these topics into context, but also that might be useful for upcoming client meetings. So, if you're interested in seeing that, you can go to kitces.com/FAT12 to see that article and all of those charts.
Addressing Whether Commodities Belong In Client Portfolios Amidst Elevated Prices [11:48]
Adam: Now, in that last conversation, we were talking a good bit about oil and the effect of oil on the inflation rate. I can see that hitting clients in a few areas, one, of course, at the gas tank as they've been filling up over the last several months, but I'd imagine, when they're talking to their advisors, perhaps saying, hey, commodity prices are up. Is this the time for me to be in commodities? So, I guess, broadly, how do commodities fit within the portfolio? And I would say it's sort of in a historical context, and why might advisors or their clients consider an allocation or not?
James: Well, Adam, as you know, commodities can be a challenging conversation to have with clients, especially those who focus on specific commodities like gold, silver over the past couple of years. So, there are a few key facts to keep in mind here. The first is that commodities, as a broad index, those are the best-performing asset classes so far this year.
And really, when you look across history, one of the charts that you mentioned in that piece looks at different asset classes and how they perform each year. What you see is that commodities are highly, highly volatile. So not just the individual commodities, but as an asset class.
And there are periods where, yes, oil prices spike that year or industrial metals jump, and therefore, you have high returns for that asset class. But there are other years where it's the worst-performing asset class. So, of course, ultimately what this comes down to that your audience knows very well is that it's about diversifying across these different asset classes, not just focusing on commodities or U.S. large cap stocks, etc. Now, when we dive into commodities and what they've done over the past year, there are a few different interesting stories. One is just with precious metals.
So one of the key stories last year that ended this last January was that gold and silver had basically skyrocketed to new all-time highs. And this, of course, caught a lot of attention. Now, at this point, where we are today, after the end of the third quarter going to the fourth quarter, you have both of those prices still significantly lower than those all-time highs. And really, that just speaks to how volatile precious metals can be.
I think a lot of advisors know the story of the long-term gold trade, which is that you have these boom-and-bust cycles where, yes, it does very well in inflationary environments up to 1980. Then you have this long, almost 30-year bear market. Then it jumps up again after financial crisis and is basically flat until very recently.
And so, it's just an asset that is very hard to incorporate into portfolios unless it's properly diversified. And it's not just precious metals. You have industrial metals. So copper is one of the focuses right now. Copper is especially important in data centers, which is one of the key themes driving equity returns and earnings.
So you need copper for cooling, for electricity, for wiring in data centers, and that's driven those assets as well. And, of course, we've talked about oil multiple times here. You have the war in Iran, you have the Strait of Hormuz still being effectively closed. You have other geopolitical conflicts in the region affecting the Red Sea and Saudi Arabia and their pipeline. And so, all these different factors are affecting commodities today.
So, ultimately, I think the key client takeaway, without going deep into the weeds on any individual commodity, is that these are highly, highly volatile investments. And the key here is not to just get hung up on gold or silver when they're performing well. It's how can they play a role in the overall portfolio? Are they pro-cyclical? Do they rise when everything else in the portfolio is rising, like equities, which is often the case? Or can they have some sort of diversification effect, which is also possible too?
Adam: Yeah. It seems like, at any point, there's something that's some sort of investment or commodity or otherwise that's flying high. That might get a client's attention. You can't miss the news headlines, oil's up this percent this year. "Oh, should I be in oil?"
So I think that context that you gave about, whether it's oil or other commodities, their volatility is a real important factor to get across to clients, and perhaps a great opportunity to show an image of just what those spikes have looked like over time and perhaps put it in greater context for them that when you see it have a peak or a real spike, that it could have a downturn afterwards. At the same time, perhaps, for some clients, being a part of a diversified portfolio. So, bringing that conversation sort of back to a higher level. So, thanks for those points there.
Strong Earnings Boosting Equity Returns [16:17]
Adam: Now, let's move over to equities, often the largest part of clients' portfolios. So when it comes to equities and equity values, you kind of have two sides. You have the earnings that feed into that, but also valuations. So perhaps you could talk about what we've seen so far this year and in the most recent quarter on both of these in terms of what's driving the positive equity returns that we've experienced.
James: Well, Adam, if I could summarize the third quarter into two factors, one is high interest rates, which we've already discussed. The second is that corporate earnings are exceptionally strong. So, when we look at corporate earnings over the long run, that's really what drives stock markets and stock market valuations. If you overlay earnings per share with the overall S&P, for instance, there are points where they disconnect a bit. But really, you're looking at the same rough pattern.
And that shouldn't be unusual for advisors or long-term investors. We know that when the economy does well, that, hopefully, filters in through to earnings and higher profit margins. And that's ultimately what drives dividends, is what drives valuations higher. It's really what supports investors and those long-term portfolios.
And so, when we look at earnings today, what's exceptional is the fact that on a trailing basis, it looks like we've experienced earnings of roughly 30% growth over the past year, which is absolutely astounding. Compare that to the historical average of around seven or eight percent growth.
So, when we look ahead, many of the Wall Street consensus forecasts right now expect that level of growth to continue. So, over the next year, we're looking at about 20% growth, which, again, is several times higher than what we've seen historically. And on top of that, we're expecting the S&P 500 to hit $400 earnings per share over the next year as well. So, no matter which way you cut it, these are huge numbers.
Now, when you dive into individual sectors, that's where the story gets a bit more nuanced. All sectors are performing well right now. We have earnings growth across all the 11 sectors of the S&P 500. But, of course, it's the information technology and the so-called AI-driven sectors that have benefited the most.
So, whether it's information technology itself, or it's communication services, consumer discretionary, these are sectors that are benefiting from the build-out of data centers and the increased use of digital technologies and automation. And so that's really driving, not only profit margins higher, but revenues, as well as, then, bottom-line earnings.
Now, how does that affect valuations? Because it's also the case that valuations have been quite high for the overall stock market over the last several years. At one point, we were just a couple of points away from the peak valuations that we saw during the dot-com boom. And when you look at valuation, so if you think, for instance, of a price to earnings ratio, yes, those prices in the numerator, those have jumped up double digits this year because we've had double digit returns in most of the major indices, getting them to near all-time highs.
But when you look at that denominator, that earnings number, because they're growing so quickly, and, in fact, growing faster than the overall return of the market, that's helped to keep valuations in check. So, the overall PE ratio for the S&P 500, for instance, has come down a bit from above 20 times forward earnings down to about 19 times.
Now, of course, all of this is uncertain. It doesn't guarantee that the market's going to continue to do well the same way it has over the first three quarters of the year, but it does tell you that earnings growth is helping to provide fundamental support for the overall market, which is, of course, positive news for most investors.
Adam: Very interesting. I think a topic for a lot of advisors over the last couple of years was all the attention being given to the "Mag Seven" stocks, the concentration in there. They were solely responsible for driving returns. But from what it sounds like you're saying, the breadth has improved in terms of sectors seeing improved performance. So, I would imagine that's sort of more supportive of a continued bull environment.
James: Yeah. That's exactly right, Adam. You have seen it broadening out of that performance. Now, the Magnificent Seven and other information technology and communication services stocks are still big drivers of the overall stock market. But, of course, this year, you have some more idiosyncratic and more recent themes.
So the fact that oil prices are high, like we've talked about multiple times now, that's helped to drive the energy sector and energy sector earnings. And so, you have a lot of different themes here that are playing together and they're basically helping to support the overall market. And so, we have shifted, as you mentioned, from a world where it was just seven names versus the 493, to a larger breadth of companies helping to support portfolios today.
Putting Recent AI Into Context For Clients [21:06]
Adam: And you mentioned AI in there. Can't go a day without seeing some sort of AI-related headline, whether it's about advances in technology, IPOs, things like that. How can an advisor put what's going on in the AI world into context for their clients?
James: It's a tricky conversation. And that's because there are just so many ways to talk about AI. There's almost existential headlines around AI right now and what's going to happen next. There's the nature of the technology itself. And then there's the nuts and bolts like the data center buildouts that we talked about earlier.
And so, as an advisor sitting down with a client and trying to navigate all these different avenues of conversation, especially if the client is doing a lot of reading on their own, it can be very challenging. So I think trying to corral that conversation into something bite-sized is really important.
And the key things are this. One is that regardless of what the direction that AI goes in in the future will be, it is the case that data center buildouts and the infrastructure aspect of AI, that's what's driving a lot of the returns and a lot of the growth that we're seeing right now. And that's filtering throughout the entire market. And it's not just the largest tech companies.
So one of the asset classes that's doing well this year is small caps. And that's because a lot of small cap companies help plan to a lot of those themes and the infrastructure buildouts. I think the things that are less certain, if we think about other aspects of that conversation, are there was a term earlier this year, SaaSpocalypse.
And that was a question of whether SaaS or software as a service companies would be able to survive in a world of AI. And that was a problem for a few weeks earlier this year and caused a lot of volatility in the market. But, for the most part, I haven't really heard that term being mentioned in the news very much over the last few months. And I think a lot of that has settled down.
So I think the themes have gone from, well, there's just a few "AI companies" out there, and maybe they'll IPO in the near future, maybe they won't, to, how can AI benefit corporations across the board, and, therefore, support the entire portfolio. And the way to think about that, the best parallel, I think, is if you go back to the dot com boom in the 1990s, that information technology revolution.
Yes, there were a few key winners. And, of course, there was the dot-com boom and bust. But if you think about the largest technology companies today, the ones that we talked about with the Magnificent Seven, the ones that are household names, it's taken them 20 or 30 years in order to build up to where they are.
These are long-term themes. They are not just specific to individual sectors or companies. They're themes that affect the broader economy. And from a long-term investing standpoint, I think that's actually the better conversation to have, not to try to pick individual winners and losers right now, just as you might have tried in 1999 or the year 2000. But, of course, that would have been difficult then too.
How Diversified Portfolios Are Performing As Expected [24:01]
Adam: Yeah, definitely. And so, I guess putting...there's one more topic I want to discuss. But before we go there, putting it all together, it sounds like what a lot of advisors preach in terms of having a diversified portfolio is really paying off this year. You have equities being really the strong performer at a lot of performance. I think you've had both domestic and international equities performing quite well.
And then, on the bond side, while they haven't provided the return this year, as you mentioned, the yields have gone up, the income opportunity has gone up, and their ability to serve as that defensive ballast has improved as well. So that if a client, for example, is worried about some sort of AI downturn that could affect equities, that that bond portion really is well positioned at this point to serve as that ballast. Would you sort of agree with that summation, putting it all together?
James: I not only completely agree, I think you've seen that multiple times this year. So, we started the year, which I think a lot of folks have forgotten about, with geopolitical headlines around Venezuela. And so, the fact that you had overall portfolio dynamics staying balanced during that time, partly because of that fixed income allocation and portfolios, that's played a huge role there.
And so, to your point, it's one thing to just look at the headline return on fixed income and look at that in comparison with how well equities have done, but it's important to look at that overall volatility profile that's not just taking place today, but over the last nine or ten months. That's ultimately what matters. Because we all know that a lot of these dynamics could switch around tomorrow or over the next couple of months.
And what you want is that portfolio to still be fully relevant and be aligned with those financial goals when that happens. And so, yes, major bond market indices have been flat to slightly negative so far this year, but they've also played their part when it comes to the overall profile of that portfolio.
Addressing Client Concerns About The Impact Of The Midterm Elections [25:55]
Adam: Very good. The last question I wanted to bring up, which I think many advisors will feel if they have a meeting with a client in the next couple of months, are the upcoming midterm elections. Of course, advisors who have been around for a while have gone through many cycles of midterms and presidential elections, but some clients might have short memories about how they went in the past. So, what sort of data points can advisors use to put the elections into context, and what they might mean for markets?
James: Well, elections can be tricky to talk about. I know I'm probably preaching to the choir, very much so with your audience here. Like you said, they've gone through multiple, if not dozens of election cycles working with their clients. And so, the challenge we're talking about politics is, of course, that everyone has strong opinions. And really, what we ultimately need to do when we talk about investing and building financial plans is to do what we can to set those politics aside.
And I think that is a challenging thing for a lot of investors because the natural question is, well, how could it not be important what happens with politics when it comes to portfolios, the stock market, and financial investments? And the answer is that not everything that matters from a policy perspective, from a tax perspective, from a national debt perspective, ultimately filters through and affects markets and portfolios. And that concept is proven time and time again across history. But I think it can be really difficult for especially the average investor to accept.
And so, what are some examples here? Well, what we know is that, in the long run, markets follow the path of economic growth and earnings. And so, we have many charts that we've seen across history where we see that regardless of who's in the White House, regardless of which party controls Congress, you have the economy growing well, and therefore, the stock market doing well also.
Other topics that a lot of clients may actually be worried about, and maybe that's intertwined with the midterm election, for example, is really the size of the national debt. The most recent numbers show that we're at $40 trillion on the national debt, which is an astounding number. And that's well above 100% of GDP when you look at it on net terms. And I think the number that a lot of advisors might find helpful when talking to clients is that that comes out to roughly $120,000 per man, woman, and child in this country. So just absolutely staggering numbers.
But, again, the key is does this affect portfolios and markets? And I think if you took that to the extreme and you tried to use this as some sort of signal for when you should be investing and when you should be getting out of the market, it would have told you exactly the wrong thing. Because when is the national deficit the highest? It's the highest right around economic emergencies like in 2020, like in 2008. And when is it the lowest? It's when the market has already bounced back.
And so, if you were trying to time the market based on this or reacting to what's happening in Washington with your portfolio, you actually would have made exactly the wrong moves. So, focusing too much on politics can be counterproductive. And so, it's critically important that we try to educate clients by helping them understand that, yes, we all have opinions and views on politics, but let's be careful when we let that filter into our portfolios here.
One Key Takeaway For Advisors [29:17]
Adam: I think that's a really good perspective. So, now, James, given that we've covered a lot of ground today, what would be your one key takeaway for advisors on talking about the current market environment with clients?
James: Well, Adam, we've gone into some detail on lots of different topics here from inflation, and rates, to oil, to what we just discussed with politics. That said, though, I think, ultimately, the purpose here is really to not get caught up in these details. It's to not get caught up in the markets and the economy, and certainly not individual data points. It's really to help clients focus on their long-term goals.
And so, while I don't think you should ignore their concerns. In fact, we should absolutely address the specific concerns that clients have. It's more important to let them know that, we, in this industry, are a source of perspective, and insights, and that when clients do have questions about this, that they really should turn to us. They should not be turning on the TV or reading blog posts about these topics.
And if we can do that properly, then, hopefully, that helps to provide that perspective that then allows clients to really focus more on their financial plans and their long-term goals instead. So, for us, regular touchpoints to let them know, hey, markets may be uncertain right now, but we've got your back on this. And for us to be the trusted sources on that, that, to us, is really the objective here.
Adam: All right. Well, thank you so much for joining us today here on the "Financial Advisor Technician" podcast, James.
James: Great. Thanks, Adam, for having me.
Mark Twain wrote that "history never repeats itself, but the Kaleidoscopic combinations of the pictured present often seem to be constructed of the broken fragments of antique legends." This idea is typically simplified to describe market and economic events as "history doesn't repeat itself, but it often rhymes." This quote also speaks to the difference between studying history, which often focuses on the specific facts surrounding an event, and economics, which looks for patterns and similarities across events in order to draw broader conclusions. These perspectives are complementary and can serve different purposes when communicating the latest trends in the investment landscape.
For advisors helping clients to achieve financial goals, details matter when it comes to the implementation of financial plans and portfolios. But ultimately, gaining an understanding of broad and historical market patterns is what helps clients feel more comfortable investing in the current environment. After all, even if the particular circumstances differ, many trends today have occurred throughout history, including Fed rate hikes, high oil prices, markets near all-time highs, and rising interest rates. Knowing that similar events have happened before, as well as how and why this time may be different, can help clients make sense of their concerns and focus on the actions they can take to stay on track.
In this context, the goal of this outlook for the fourth quarter of 2026 is to help financial advisors provide perspective around the key themes shaping markets for their clients. Each section below includes charts, key data points, and commentary that can be used to provide some objective context when communicating with clients. They are designed to reinforce the importance of staying invested and maintaining a disciplined approach.
All of these charts can be customized with your own branding using a free version of the insights platform, Clearnomics Community. The seven charts are also downloadable here in a full PDF.
1. Bond Yields Are At Multi-Decade Highs
Perhaps the biggest factor that impacted markets in the third quarter was the climb in interest rates to the highest level in more than 20 years. This was due to the latest Fed rate hike, AI trends, oil prices, pressure on government bonds, and more.
Short-term, intermediate, and long-term yields have all jumped, with longer-term rates reaching multi-decade highs. The 2-year Treasury yield, for instance, ended the quarter at around 4.89% for the first time in more than two years. The 10-year Treasury yield touched 5.30%, a level not seen since 2002. And the 30-year Treasury yield, which reflects long-term borrowing costs and inflation expectations, moved to 5.64%, a level last seen well before the global financial crisis.
For many investors, higher rates are seen in a negative light since they raise the cost of borrowing, reduce the value of future cash flows, and can slow the economy. However, whether this is true depends on why rates are rising. If interest rates are higher due to inflation, as they were in 2022 for instance, then stocks and bonds can struggle at the same time.
The key today, however, is that "real yields" (meaning yields adjusted for inflation) are rising alongside nominal yields. In other words, higher yields are not just the result of inflation, but instead reflect positive growth trends and heavy spending in areas like AI. Of course, these trends also reflect concerns about government debt levels, a more hawkish outlook for central banks around the world, and a surge in AI-related corporate bond issuance absorbing investor demand.
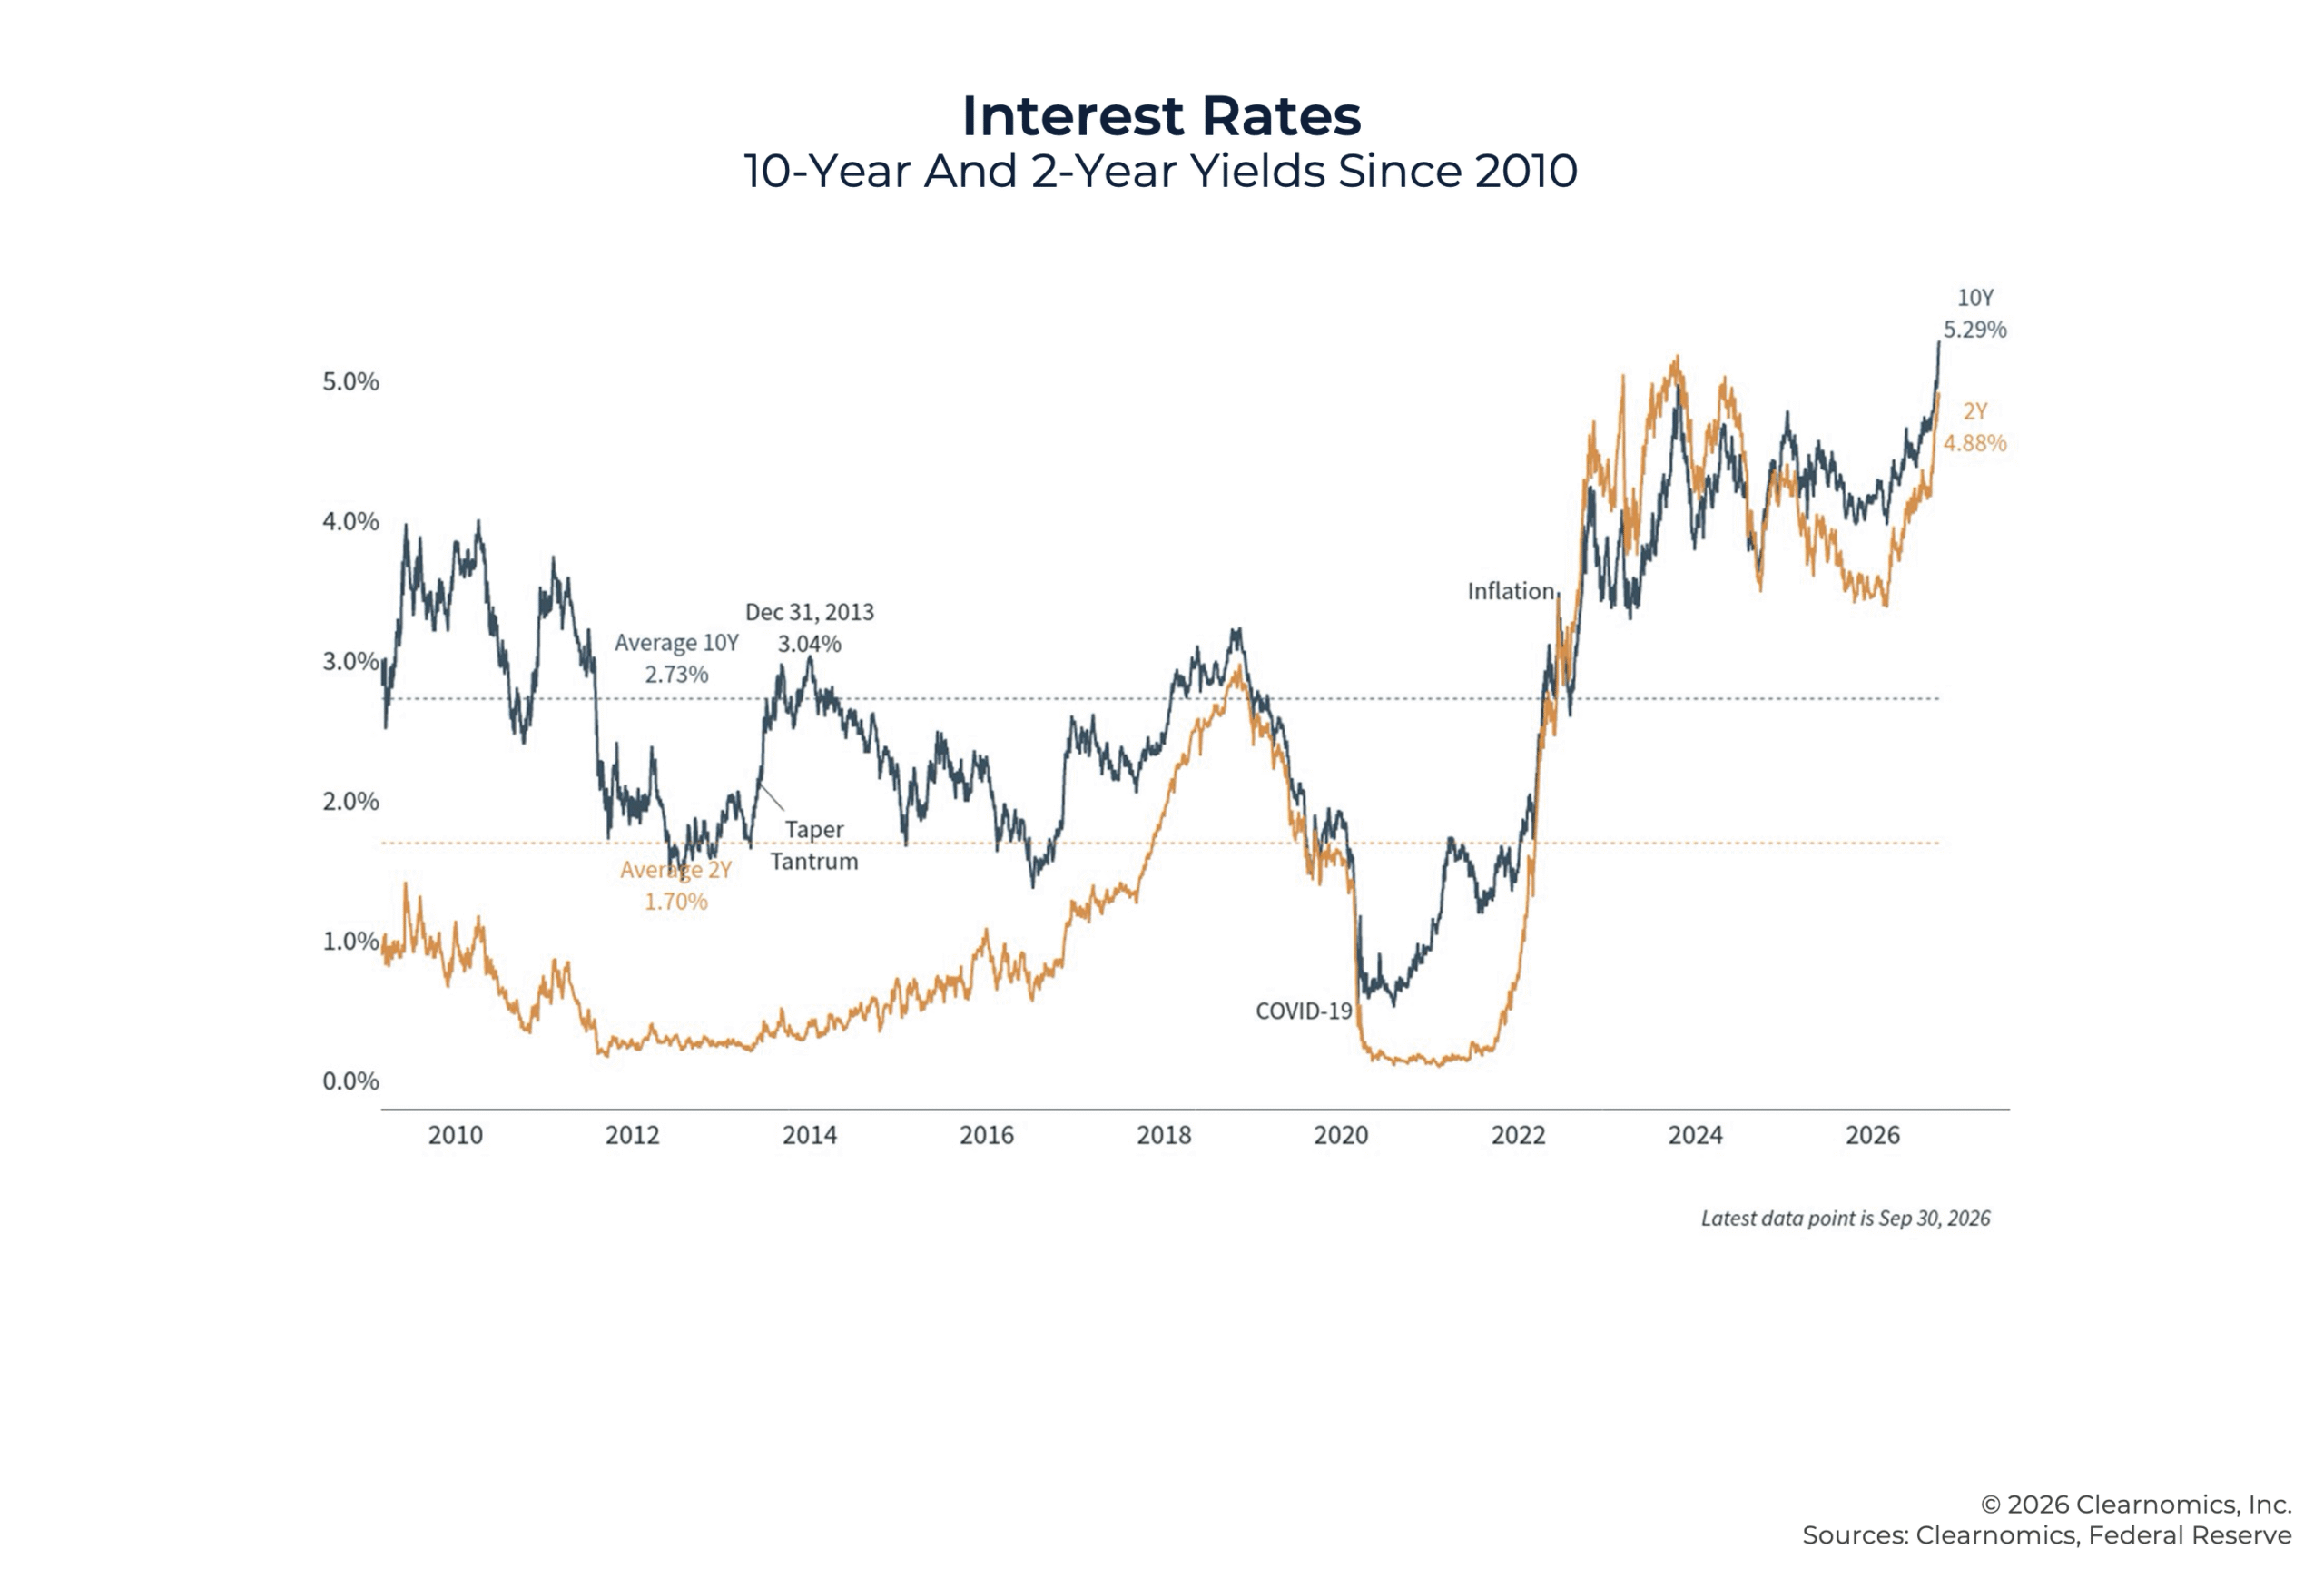
Here are some key facts on interest rates and bond markets:
- Bond yields across major fixed-income sectors are above their averages since 2009, supporting income generation in portfolios. The Bloomberg U.S. Aggregate Bond Index yields 5.6%, compared to its average of 3.0% since 2009, while investment-grade corporate bonds yield 6.0%, compared to their long-term average of 3.9%.
- The yield curve is upward-sloping for the first time in several years, with the curve adjusting to both Fed rate hikes at the short end, and long-term growth and inflation trends at the long end. The current spread between 10-year and 2-year Treasury yields of 41 basis points is below the historical average of 84 basis points, but the return to a positive slope suggests that economic conditions are healthy.
- Importantly, this move has not been confined to U.S. Treasuries. Germany's 10-year Bund yield climbed toward 3.65%, while Japan's 10-year government bond yield reached approximately 3.13%, its highest level since the 1990s. This global pattern suggests that investors are reassessing where interest rates should settle over the long run, rather than simply reacting to short-term monetary policy shifts.
Why does this matter to clients? Since bond prices and yields move in opposite directions, rising rates have kept bond returns low this year. This can naturally raise questions for those watching their stock holdings reach new highs while their bond holdings sit largely flat. When it comes to portfolios, however, this is by design, since a well-constructed portfolio is meant to hold asset classes that move in different directions in response to market and economic events.
There is also an important silver lining: while the total return on bonds has remained low this year, higher yields mean that bonds are now offering more income than they have in many years. Investment-grade corporate bonds and Treasury securities, as noted above, are generating income levels that were not available for over a decade following the 2008 financial crisis.
For investors whose objectives include generating income from their portfolios, or who want to balance the risk of stocks with more stable assets, this is a positive development. For investors who have been holding excess cash while waiting for greater certainty on rates, the current environment potentially offers an opportunity to lock in fixed-income yields at levels that have rarely been this attractive over the past two decades.
2. The Fed And Inflation
The Fed kicked off a new rate hike cycle toward the end of the third quarter when it raised policy rates by one-quarter of a percent, to a target range of 3.75% to 4.00%. This is the first rate hike in three years and follows a period of cuts from late 2024 through the end of 2025. The move was widely anticipated, with markets pricing in over a 90% probability prior to the meeting. For this reason, markets generally reacted positively, after experiencing some short-term swings.
The primary reason for this rate hike is stubborn inflation, largely driven by supply-side factors due to higher oil prices. Oil has remained volatile, with Brent crude starting the third quarter around $71 per barrel in July and ending it at roughly $108 in September. There have been several instances of these rebounds in oil prices this year which have kept energy costs elevated across different inflation measures. Of course, the Fed cannot directly affect the war in Iran or oil transportation through the Strait of Hormuz through interest rate policy. Instead, all it can do is try to prevent energy-driven inflation from spreading into other areas of the economy that affect consumers and businesses.
Here are the current inflation readings and policy expectations across key measures:
- The headline Consumer Price Index (CPI) stood at 3.4% year-over-year in August, with core CPI at 2.4%. The Fed's preferred Personal Consumption Expenditures (PCE) measure shows headline PCE at 3.4% and core PCE at 3.0%, all well above the Fed’s 2% target.
- Headline CPI inflation was primarily driven by energy costs, which rose 16.3% year-over-year. Gasoline prices alone jumped 27.4%.
- One measure of "supercore" inflation – CPI less food, energy, and shelter – rose only 2.0% in August, suggesting that energy costs have not yet broadened out to other areas. This underscores the possibility that the economy may be near "peak inflation" if oil prices improve.
- Still, consumers continue to feel quite pessimistic about the economy. Consumer inflation expectations from the latest New York Fed Survey were elevated, at 3.6% on a one-year horizon.
Another important contextual point is how the Fed is engaging with the public under the new Fed Chair, Kevin Warsh. When it comes to Fed communications, Warsh has signaled a preference for stepping back from the traditional practice of "forward guidance," or the idea that the Fed should provide a clear roadmap of future rate decisions. In fact, he has declined to submit his own forecasts to the Fed's quarterly Summary of Economic Projections. His intention is for markets to react to the underlying data rather than to what the Fed might do next. Regardless of whether this approach is right or wrong, it does mean that investors should not focus on Fed announcements, but instead on trends around labor markets, inflation, and growth.
That said, the rest of the Fed committee did publish projections, which are perhaps more interesting than the rate hike itself. The September report showed that these policymakers expect one additional rate hike in 2026 followed by rates that remain at that level through 2027. While these expectations can change quickly based on the data, they reveal that Fed officials currently support rates that are higher for longer. Market-based measures such as fed funds futures are going one step further, with markets currently expecting another 25-basis-point hike in the fourth quarter and at least one more hike in 2027.
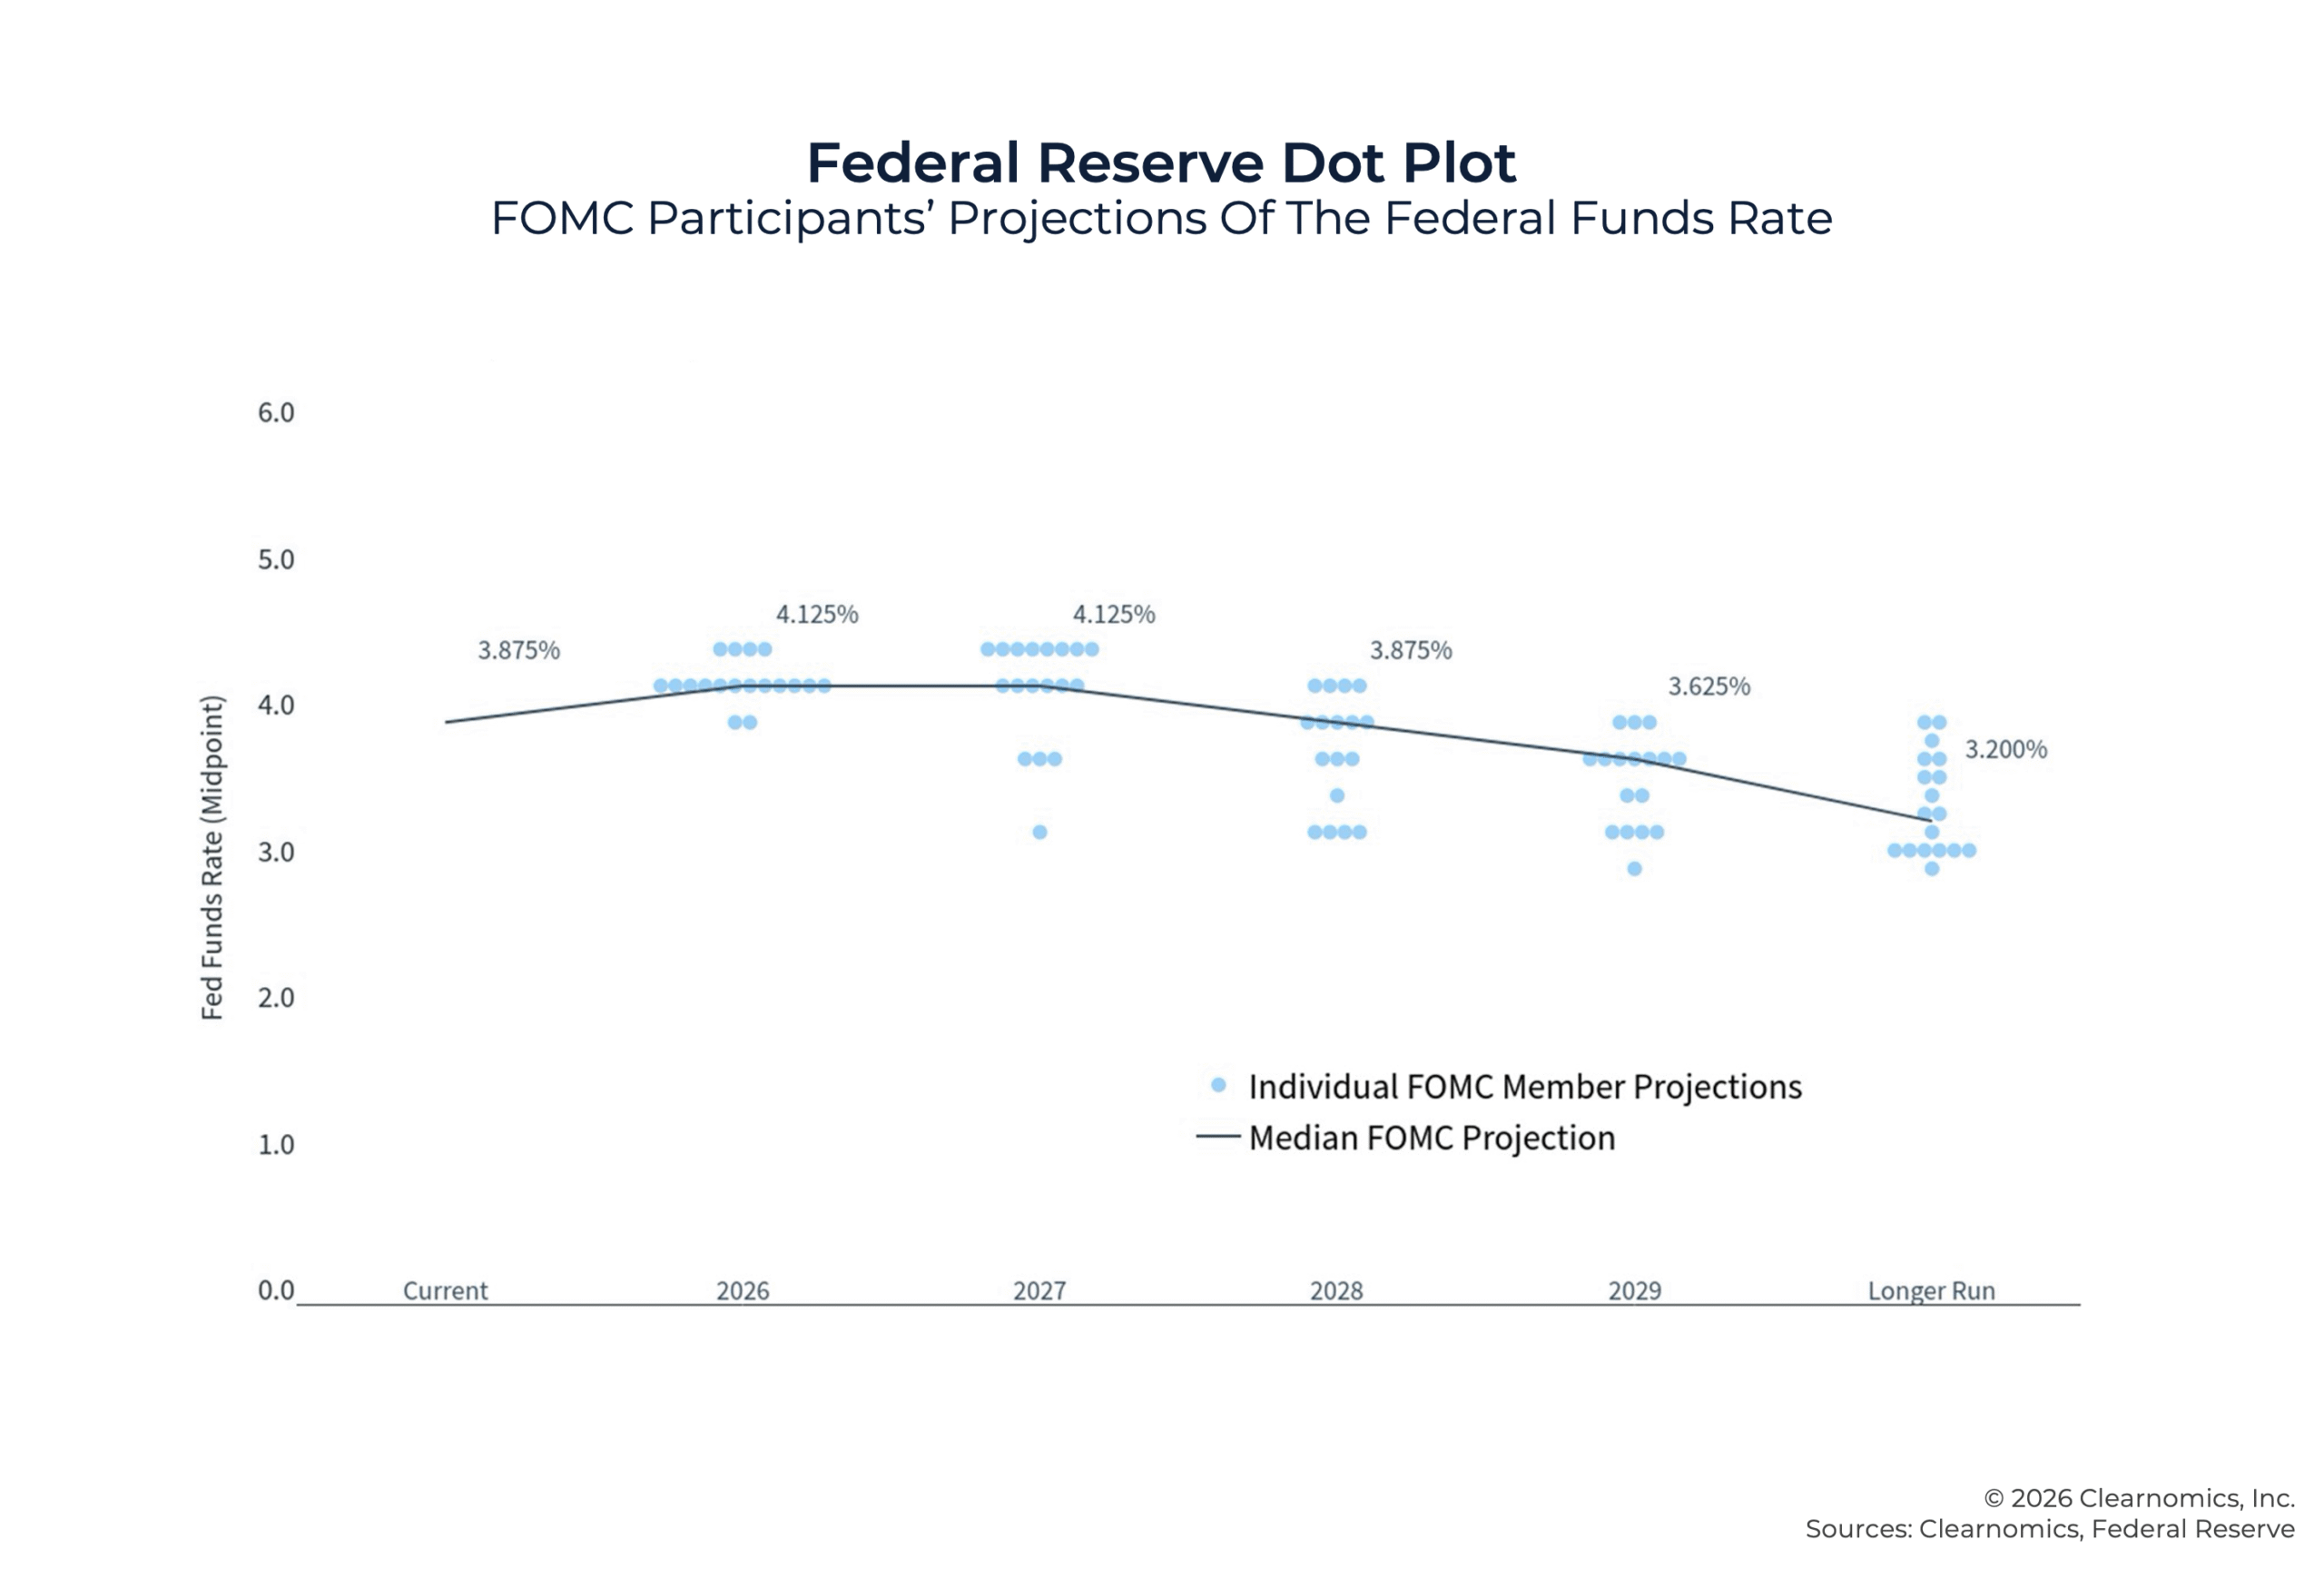
Within client conversations, it is important to focus not just on the latest Fed decision, but on the full cycle. When it comes to inflation, any surprises could change short-term expectations, especially given how volatile oil prices can be. Additionally, economists often try to look past inflation that is driven largely by supply shocks, which can be resolved comparatively more easily than inflation resulting from an overheating economy or excessive consumer demand. Today’s inflationary pressures are primarily due to oil supply challenges, and not due to the underlying business cycle.
Instead, investors should focus on what drives the Fed in the long run: productivity and growth. AI and Fed policy may seem unrelated, but they are connected through the impact on the job market and inflation. Fed Chair Kevin Warsh addressed this directly at the annual Jackson Hole symposium in August, framing the central question as whether AI would prove complementary or competitive to labor. Since technology is naturally deflationary over time, any boost to productivity due to AI could affect the Fed’s long-term Federal funds rate.
Finally, while it’s understandable that some clients view tighter monetary policy as a headwind for markets, the reality is that it depends on why the Fed is raising rates. Historically, it’s not unusual for markets and interest rates to move higher at the same time, particularly later in the business cycle. When rates rise alongside strong corporate earnings, resilient growth, and significant capital investment, as is the case today, markets can continue to advance. Over the past several months, major indices including the S&P 500, the Dow Jones Industrial Average, and the Nasdaq are still near all-time highs, even as rates have risen.
3. Strong Corporate Earnings And Elevated Valuations
Beyond interest rates and the Fed, the biggest driver of the stock market rally this year has been corporate earnings. In the long run, the stock market tends to follow the path of corporate profits, especially when valuations are above average. According to Factset, the S&P 500 could also see its third straight quarter of earnings growth above 25%. This is far stronger than what analysts expected at the start of 2026, when tariffs and oil prices were the main drivers impacting forecasts.
Just as importantly, revenues are growing above the long-term average. This suggests that these gains are not just the result of cost cutting, but also due to healthy economic growth. This is true across many sectors. For example, the construction of AI data centers has supported sectors such as Information Technology, and this growth is expected to continue. The consensus earnings-per-share growth estimate over the next twelve months is a whopping 44.1% for Information Technology, far above historical norms. At the same time, other sectors are also experiencing healthy but more modest growth, including Industrials, Healthcare, and Materials. This performance across sectors is encouraging, especially after years of outperformance by very concentrated groups of stocks, such as the Magnificent 7.
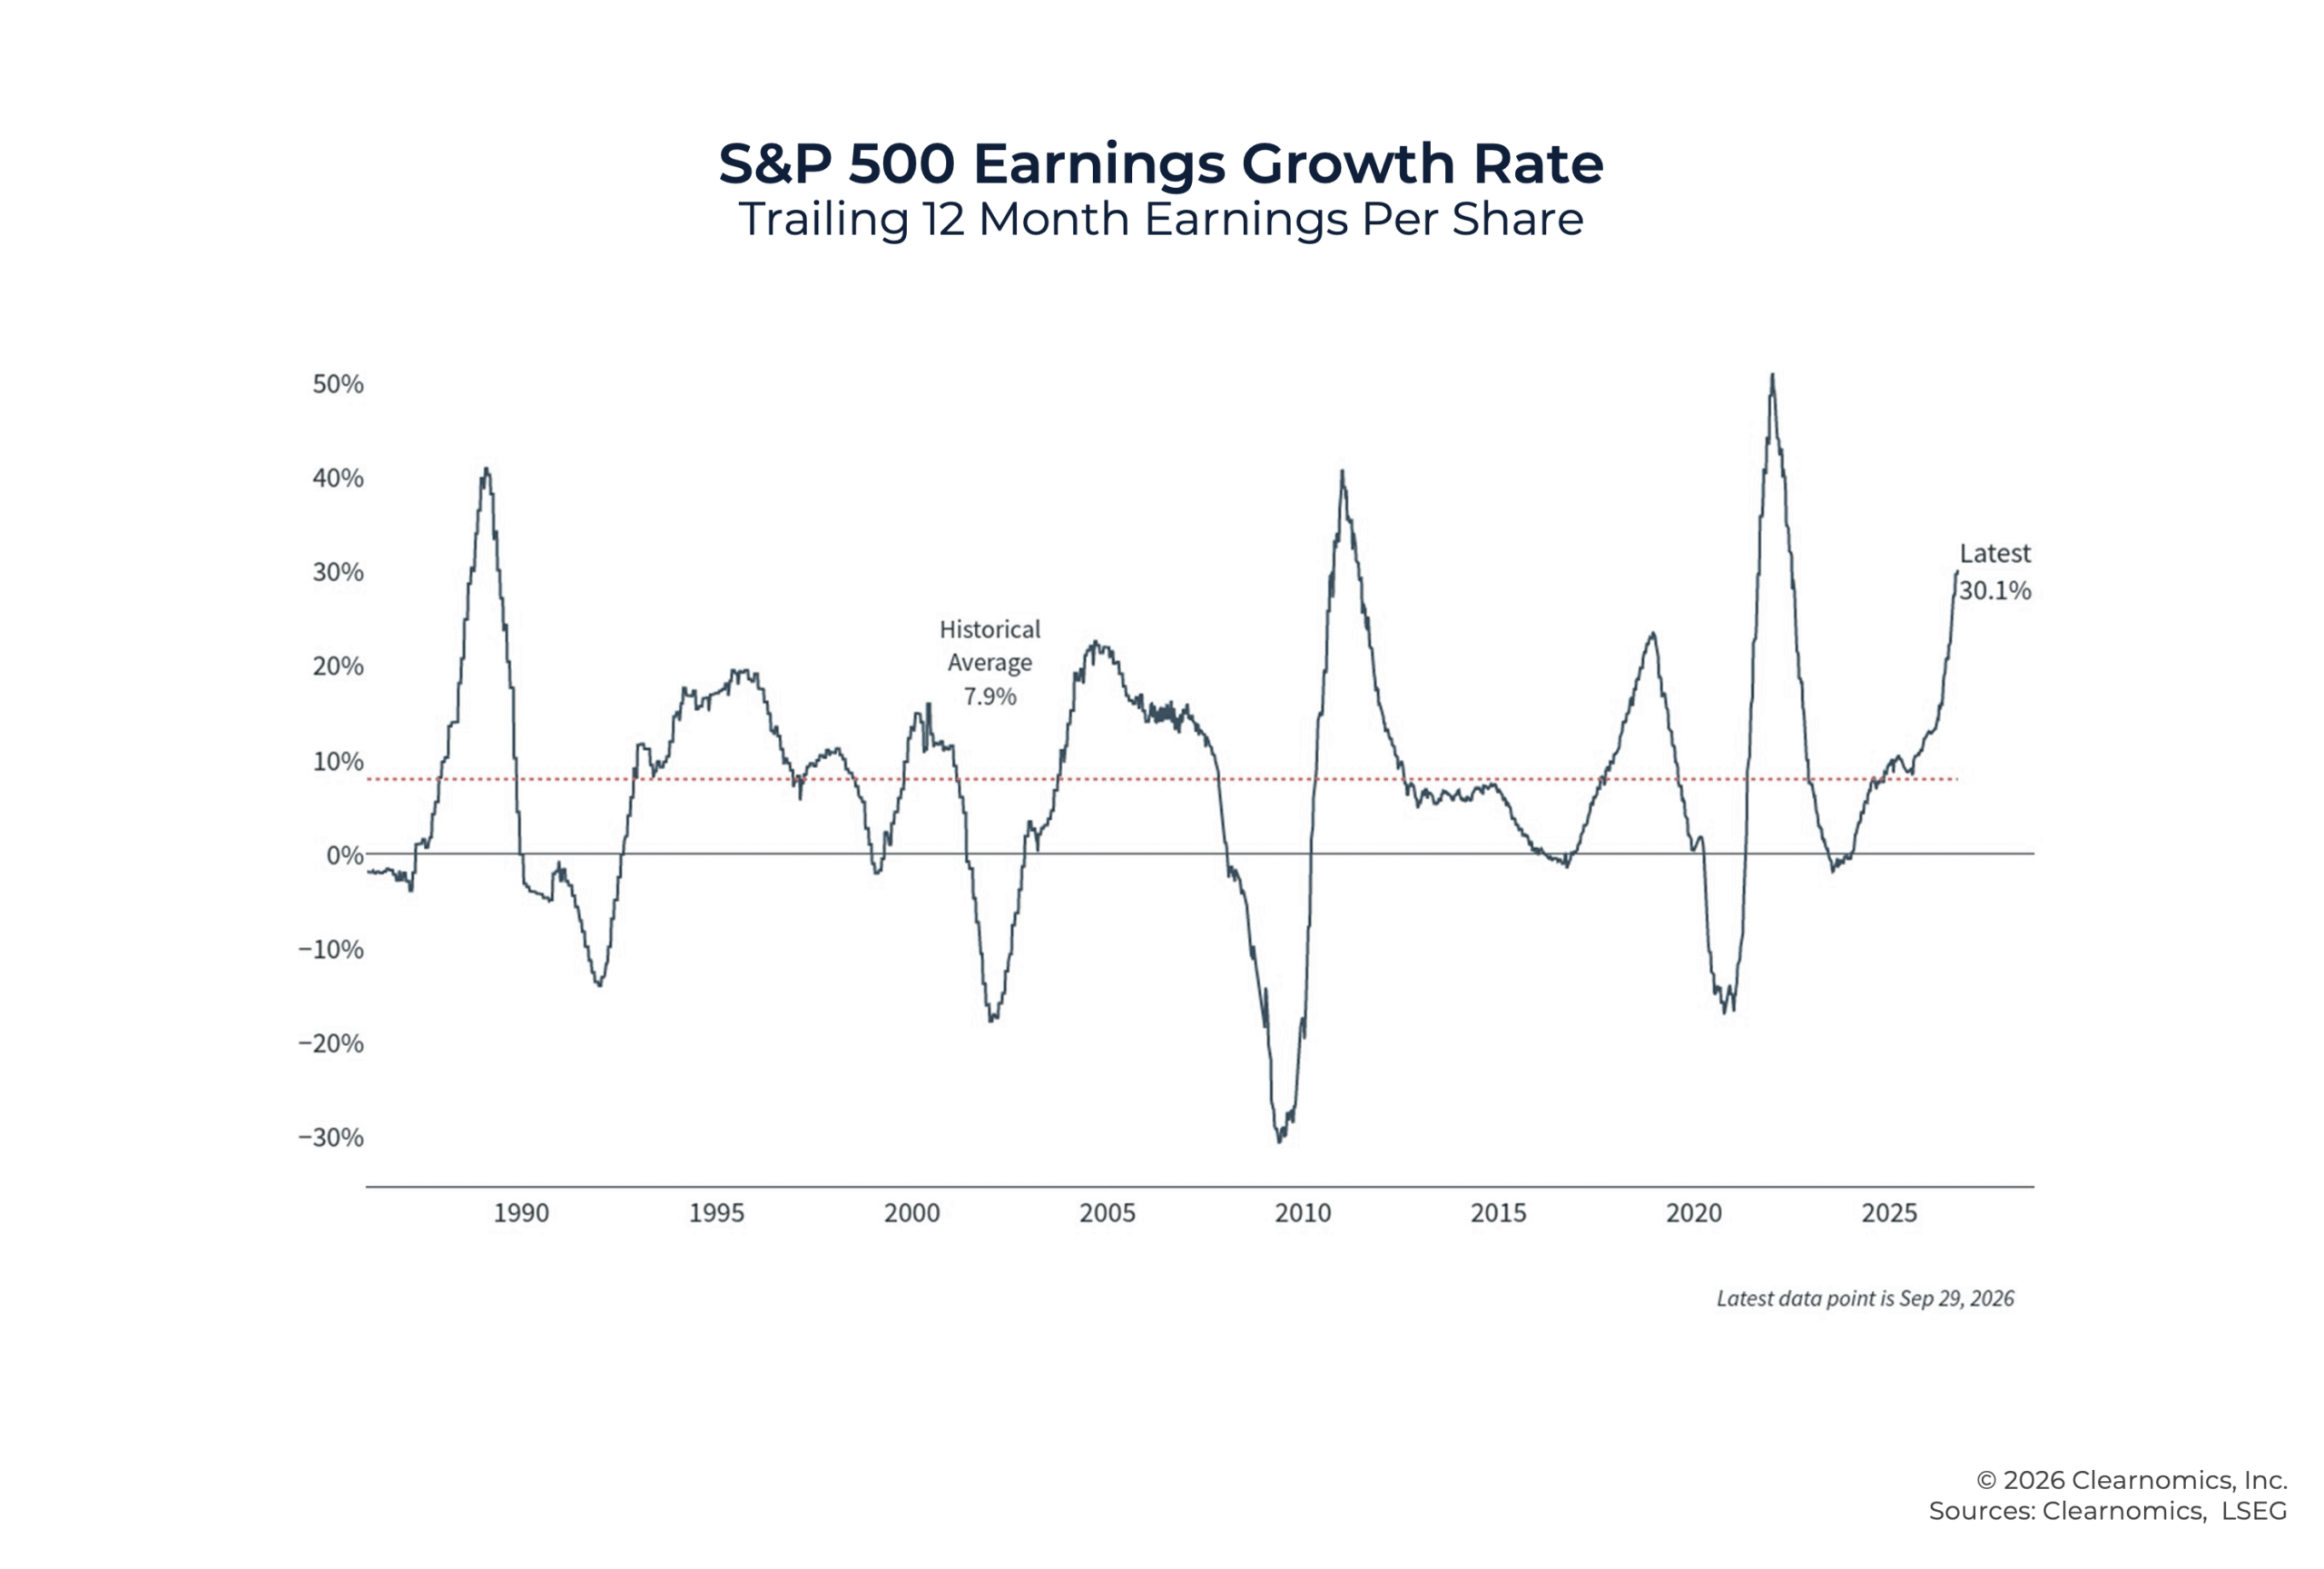
Here are some key data points on earnings and valuations:
- S&P 500 earnings have grown approximately 29% year-over-year, well above the historical average of around 8%, supported by continued technology investment, resilient demand, and margin expansion.
- Revenues are expected to grow approximately 12%, which is above the 5- and 10-year average revenue growth rate of 9% and 6%, respectively. This indicates that earnings gains have not solely been the result of cost cutting.
- All 11 S&P 500 sectors have reported year-over-year earnings growth, with five in double digits, led by Energy, Information Technology, Communication Services, and Materials.
- The S&P 500 currently trades at a price-to-earnings ratio of around 19.2X, above the historical average of 16x, but below recent peaks. Valuations have been steady despite this year’s rally because fundamentals have also improved.
- International earnings have improved as well, supporting the outperformance of international stocks in 2026. Year to date, emerging markets have experienced a return of over 20% and developed markets of around 10%, supporting a geographically balanced portfolio.
When discussing markets with clients, it’s helpful to go beyond returns and focus on these fundamental drivers. Historically, strong earnings provide a foundation for the market, since profits are ultimately what drive stock prices over time. At the same time, high expectations are already reflected in stock prices across some sectors. High valuations are not a reason to avoid the stock market, as our own research and that by groups such as LSEG suggest that valuations correlate inversely with intermediate and long-term annualized returns, rather than near-term market performance.
4. Commodities, Including Oil And Copper, Are Influencing Markets
Commodity prices matter because they both directly and indirectly impact the economy and markets. They are often closely followed because they are sensitive to global economic conditions, and can also affect other parts of the market. For example, higher oil prices can drive inflation as rising costs are passed onto consumers, while also supporting energy stocks through revenue growth. So while not all clients will have direct commodities exposure in their portfolio, it is helpful to understand how the asset class impacts other components of a portfolio.
The biggest story this year has been oil, which has affected all corners of the economy. Brent crude reached more than $100 per barrel in September after previously jumping to nearly $120 in April. Concerns over the ability to ship oil around the world from the Persian Gulf have centered around the Strait of Hormuz, which continues to see disruptions. More recently, however, the Yemen-based Houthis have struck Saudi Arabia’s energy infrastructure and another critical waterway, the Bab al-Mandab Strait, which connects the Red Sea to the rest of the world. After several false starts around peace deals earlier in the summer, it remains unclear how and when the conflict will be resolved.
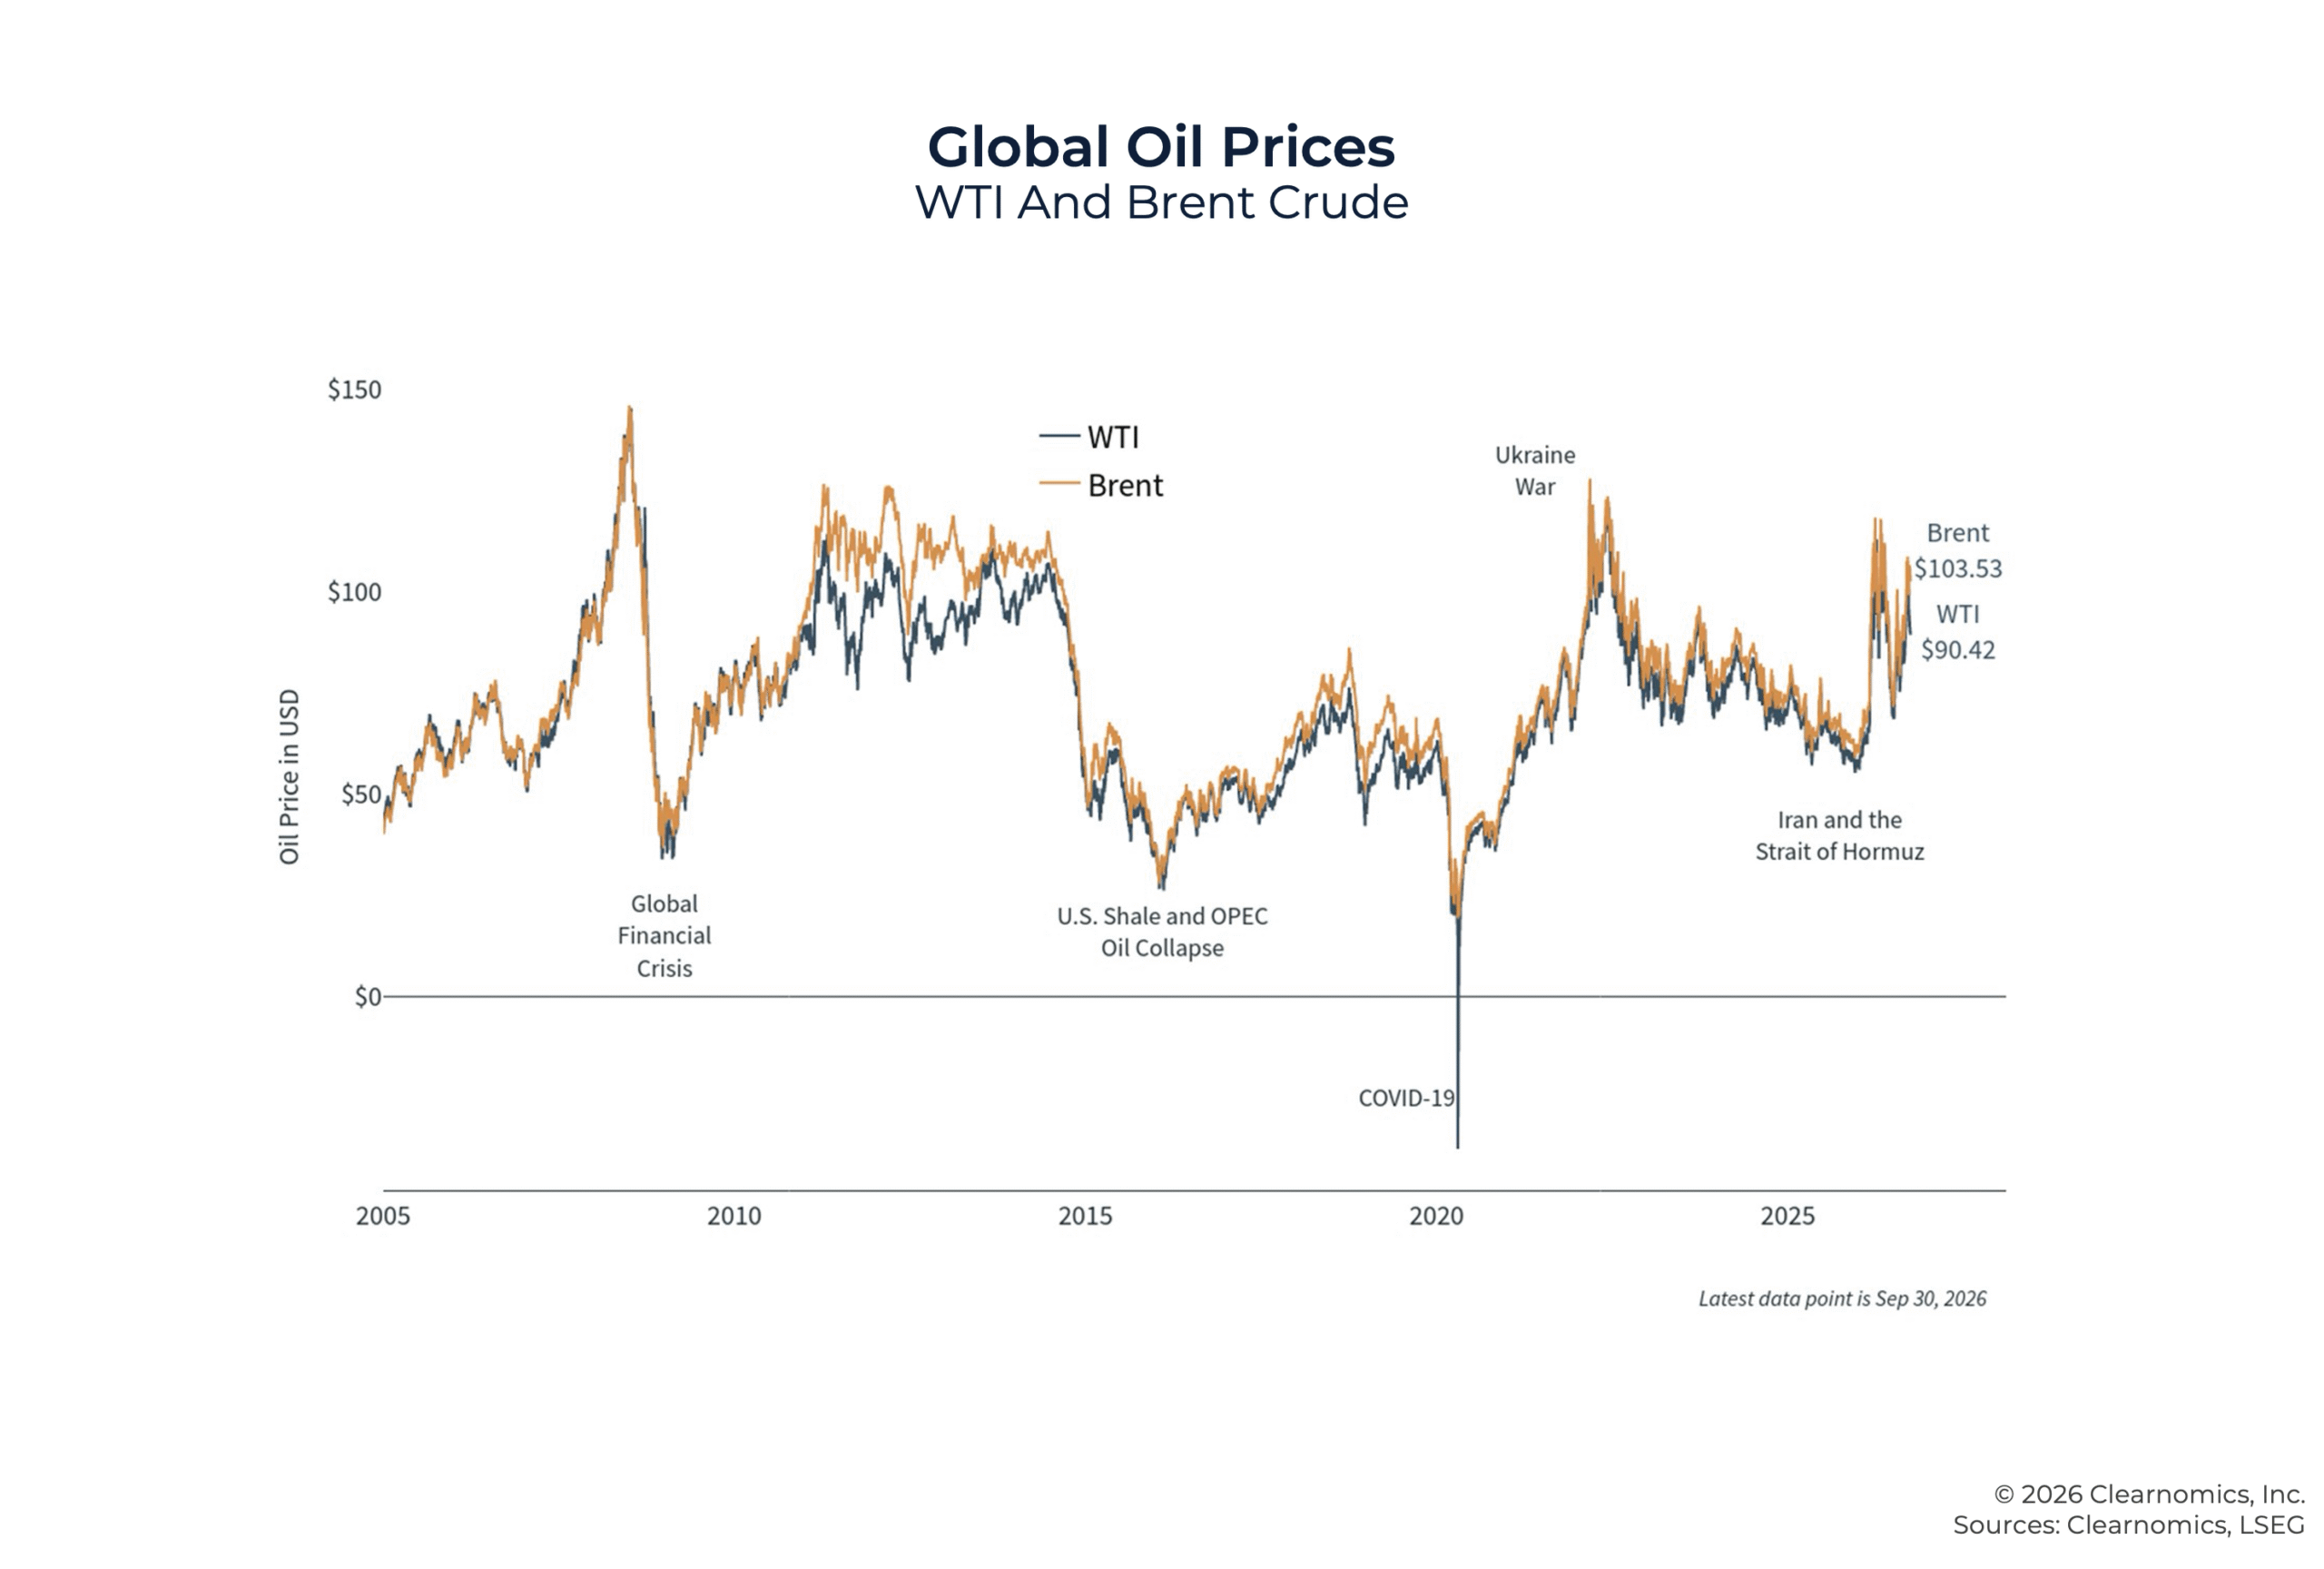
These commodity moves are not just about oil. Copper has also quietly climbed to all-time highs, up approximately 17% this year. The rally is being driven by the importance of copper in electronics and data centers. For example, copper is a critical component in power delivery systems, including electrical wiring, and is very efficient at transferring heat. This makes it essential for keeping large data centers and thousands of semiconductor chips cool. At the same time, recent reports from the International Copper Study Group show that copper-mine production has fallen 1.1% in the first half of 2026, with declines exceeding 10% in Chile, the Democratic Republic of the Congo, and Indonesia.
Additional factors have made these dynamics more acute, including concerns that the U.S. may place tariffs on copper imports and the resulting tight supplies driven by those trying to get ahead of these import duties. While it may seem unusual to impose new tariffs on such a necessary industrial metal, these tariffs are being explored under Section 232 of the Trade Expansion Act of 1962 with the goal of promoting domestic production for national security reasons.
Here are some key data points on commodities this year:
- U.S. oil production is hovering around 13.8 million barrels per day, which has helped to insulate the country from oil shocks. Still, the U.S. does continue to depend on oil price imports due to factors such as refinery infrastructure.
- According to AAA, the national average for regular gasoline is up about $1.60 per gallon year-to-date, climbing from roughly $2.83 at the start of January to $4.43 by the end of September.
- Copper recently notched its longest weekly rally streak since 1994, reflecting how tight supply (which is shrinking for the first time in years) and structural demand can compound in the same direction.
What matters most for clients is not where oil or copper will trade next week, but what supply and demand signal about the broader economy and how these moves impact a balanced portfolio. These price swings don’t just affect commodity indices, but the many stocks that are sensitive to these prices as well.
5. Midterm Elections: Long-Term Perspectives
As citizens, voters, and taxpayers, there is nothing more important than elections, which shape the direction of policy on issues including entitlement programs, taxes, and the Federal debt. However, when it comes to investing, it’s important for clients not to vote with their portfolios.
This year's midterm election in November is taking place against a complex backdrop of tariffs, geopolitical conflict, inflation, AI concerns, and more. It seems natural to believe that politics should drive the stock market, since elections affect economic policies which in turn influence industries and companies. It’s also easy to assume that election years may simply be more volatile as a result. However, history shows that this isn't the case. Instead, markets have performed well and the economy has grown under varying political leadership over the past century.
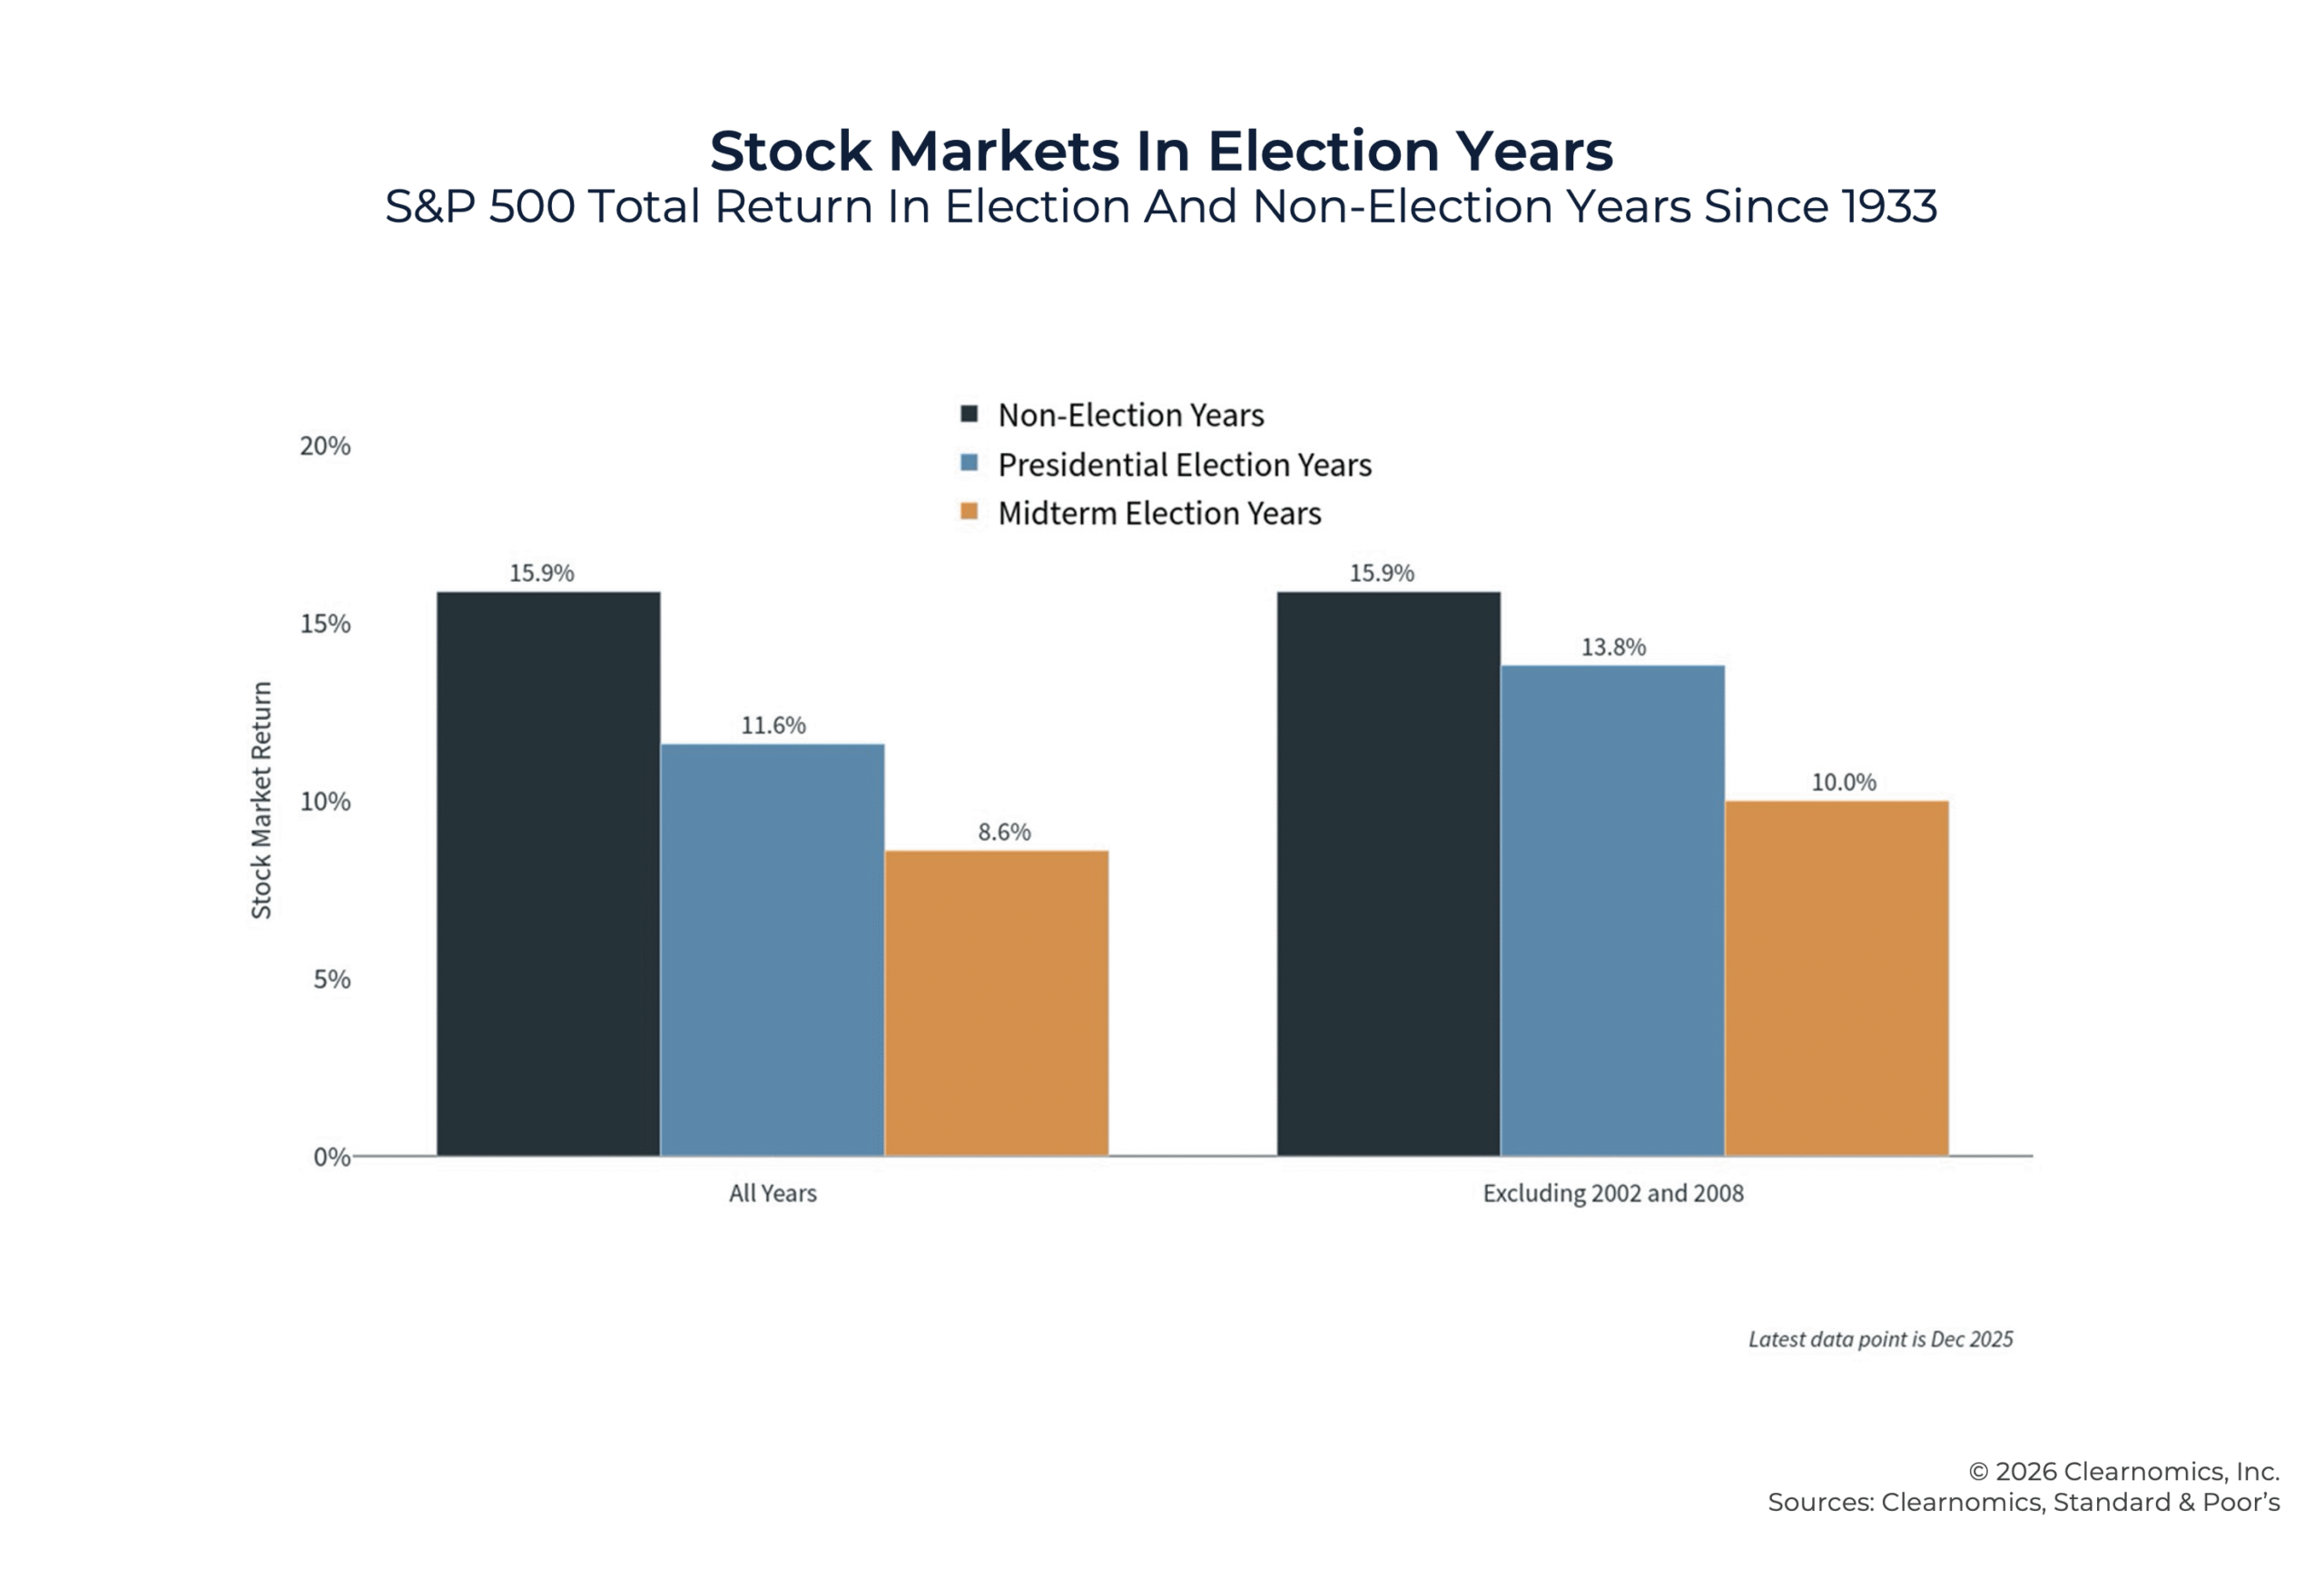
This does not mean that every midterm year has been positive. Each period was shaped by a unique set of circumstances depending on the phase of the business cycle. Recent midterm election years, for instance, include 2022, which saw significant inflation in the wake of the pandemic, as well as 2018, when many worried about global growth and Fed policy. In both cases, returns were negative due to the underlying economic trends, not because they happened to be midterm election years.
Here are some key talking points for election discussions:
- Since 1933, the S&P 500 has averaged annual total returns of 8.6% during midterm election years. While this is lower than during presidential election years and non-election years, this is partly due to outlier years such as 2002, 2008, and 2018. Regardless, these years experience positive returns on average.
- When it comes to which political party controls Congress, there have been no configurations that have consistently coincided with poor market returns. This is primarily because the market is driven by underlying growth trends that are not due to politics alone.
- On average, the market has seen positive returns when Republicans and Democrats are in the White House – regardless of which major party controlled Congress, or if control was divided.
- The key lesson from history is that factors such as corporate earnings, interest rates, and other long-term trends matter far more to investors than any individual Congressional race.
In client conversations, it is important to address client concerns while helping to separate these issues from those of long-term investing and financial planning. What matters most is that the business cycle, corporate earnings, and interest rates have historically been far more important drivers of markets than which party controls Congress.
6. AI, IPOs, And Productivity
It’s impossible to discuss market trends without also focusing on recent trends in artificial intelligence. AI and digital technology more broadly have been among the biggest forces behind the market's climb over the past several years, lifting indices to new highs. At the same time, investors are increasingly asking whether AI investments in data centers and within large companies will pay off, particularly as valuations continue to rise. This question has accompanied every major innovation in technology, from the internet, to personal computers, electronics, and even railroads. Historically, the true benefits to the economy and financial markets generally have taken longer to materialize than investors expected, so taking a long-term perspective on these trends is especially important.
Since the benefits of new general technologies can be dispersed across all industries, investors can benefit from diversification across various market sectors. However, some investors may find it increasingly difficult to do so, particularly as buzzy new IPOs are announced and headlines focus on AI trends. OpenAI and Anthropic, both leading AI companies, are exploring their public debuts. Some will view this as a healthy development, since public markets impose discipline and disclosure that private markets do not, and public shares expand access to these companies. However, others might argue that going public may be unhealthy as these companies become beholden to public shareholders’ interests. When it comes to IPOs and the excitement that surrounds them, the most important consideration is how these businesses perform across many market and economic cycles, not just how they trade in their opening week. The largest technology companies today, for instance, grew over decades through many different environments.
The more fundamental question is whether AI is translating into true economic gains. According to the Bureau of Labor Statistics, nonfarm business productivity growth was 1.4% in the second quarter, compared to 2.1% across the current decade and a high of 2.7% in the 2000s. While the latest figure is positive, there is no definitive evidence yet that these gains are the result of AI. In fact, many of these trends began even before ChatGPT was announced in 2022, due to the adoption of automation and other technologies that accelerated during the 2020 pandemic.
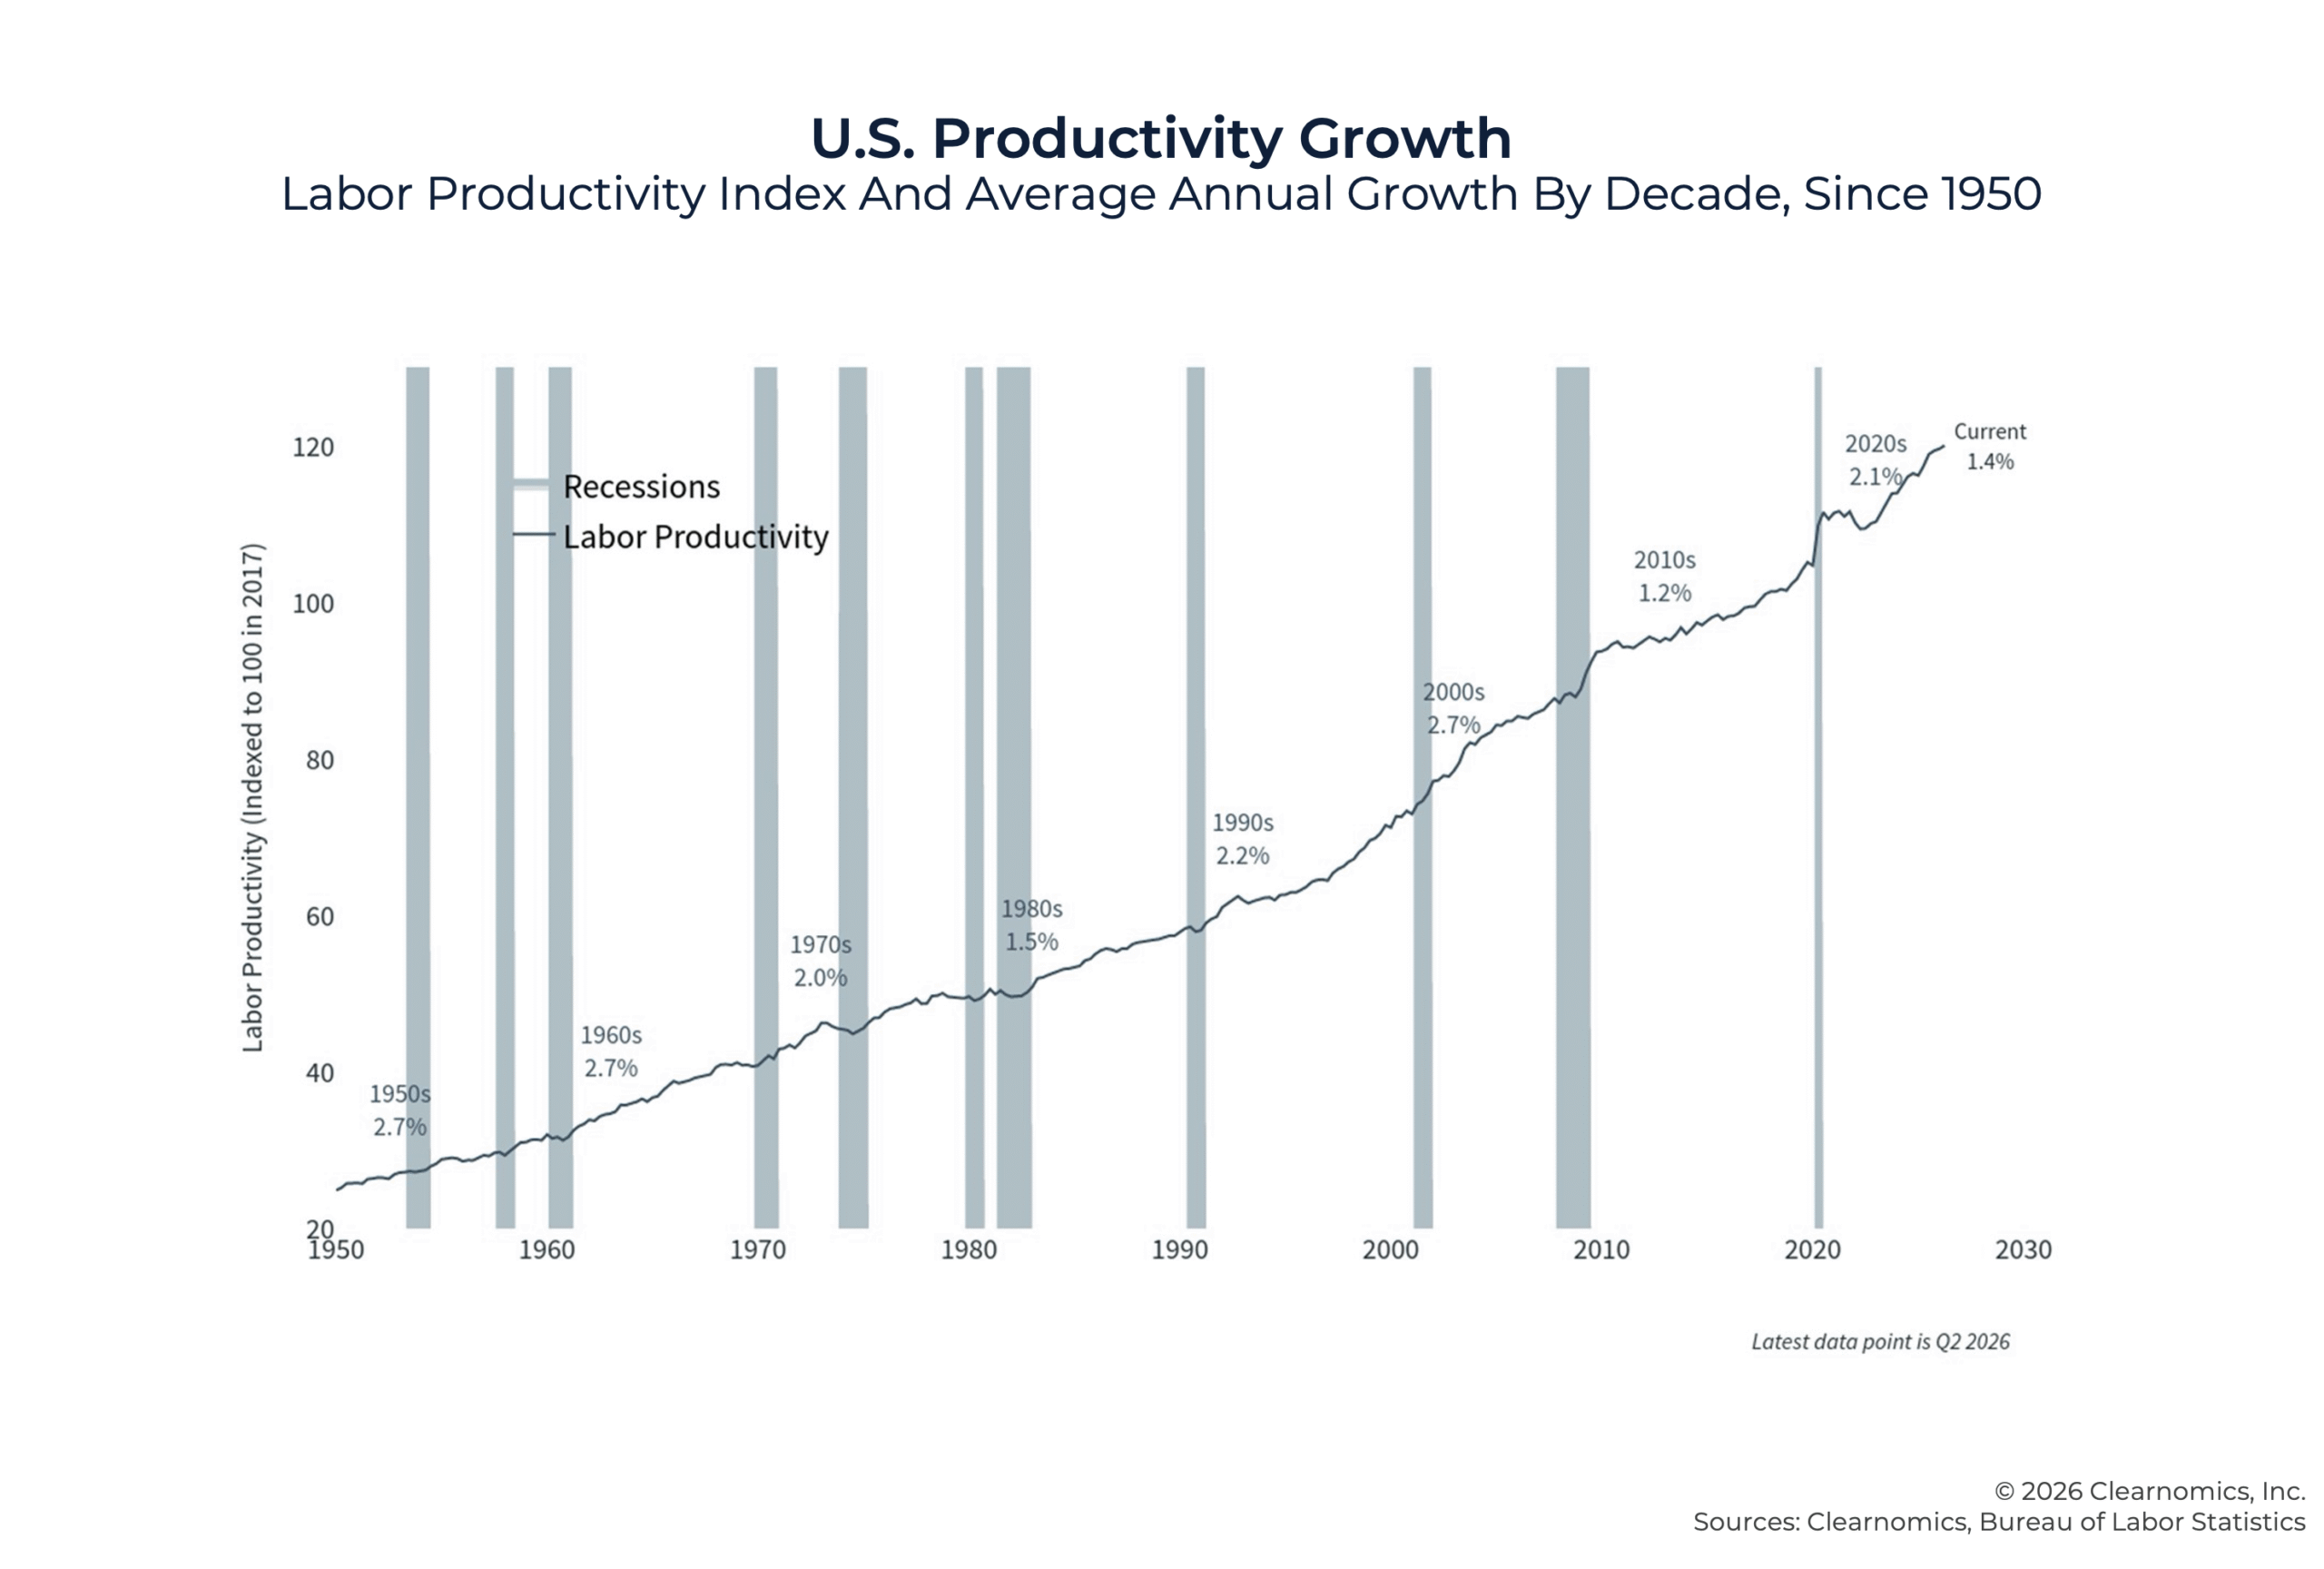
Here are some key facts on AI, productivity, and the IPO landscape:
- Nonfarm business productivity growth was 1.4% in the second quarter, below the pace that would confirm a structural, economy-wide productivity boom driven by AI.
- Specific AI-related companies now represent a larger share of major indices, meaning shifts in AI sentiment can have an outsized effect on broad market returns. The Magnificent 7, for instance, has returned over 1,000% since 2018, versus over 250% for the Nasdaq Composite.
- Productivity growth has varied significantly across decades but has typically risen alongside the adoption of new technologies, as it did during the 1990s expansion, even though it took time to materialize.
For clients, it's important to have a balanced view of AI, especially amid headlines on the impact of AI on technology and society. When it comes to investing, however, it continues to be the case that diversifying across many of these AI-related areas is the best approach. The dot-com boom is a helpful parallel, since investors could have either focused on the short-term declines following hot IPOs, or the long-run benefits of greater productivity across the economy. Over the past two and a half decades, doing the latter has helped clients to achieve financial success without having to try to time every market turn.
7. Many Asset Classes Are Supporting Portfolios
All of these developments in the third quarter and throughout the year have been reflected in strong returns across many asset classes. U.S. large-cap equities, small caps, international equities, commodities, and some fixed-income sectors have all produced positive gains in 2026, supporting many types of portfolios. These gains reflect strong performance across several major asset classes, even as market breadth (participation within equities) has been deteriorating.
Within the U.S. stock market, both domestic and international stocks have been supported by strong earnings and technology-related investments. Major U.S. indices, including the S&P 500, Nasdaq, and Dow Jones Industrial Average, are hovering near all-time highs, with the S&P 500 up approximately 12% year-to-date through the end of September. International stocks have also posted strong returns, supported by the continued surge in AI infrastructure spending which has boosted the returns of semiconductor companies.
Elsewhere, the Bloomberg Commodities Index has outperformed most other asset classes, with a total return of 32.9% through the third quarter, driven by oil, copper, and other metals discussed above. At the same time, the pullback in gold and silver, along with their long boom-and-bust histories, are helpful reminders to maintain a long-term view when it comes to volatile assets.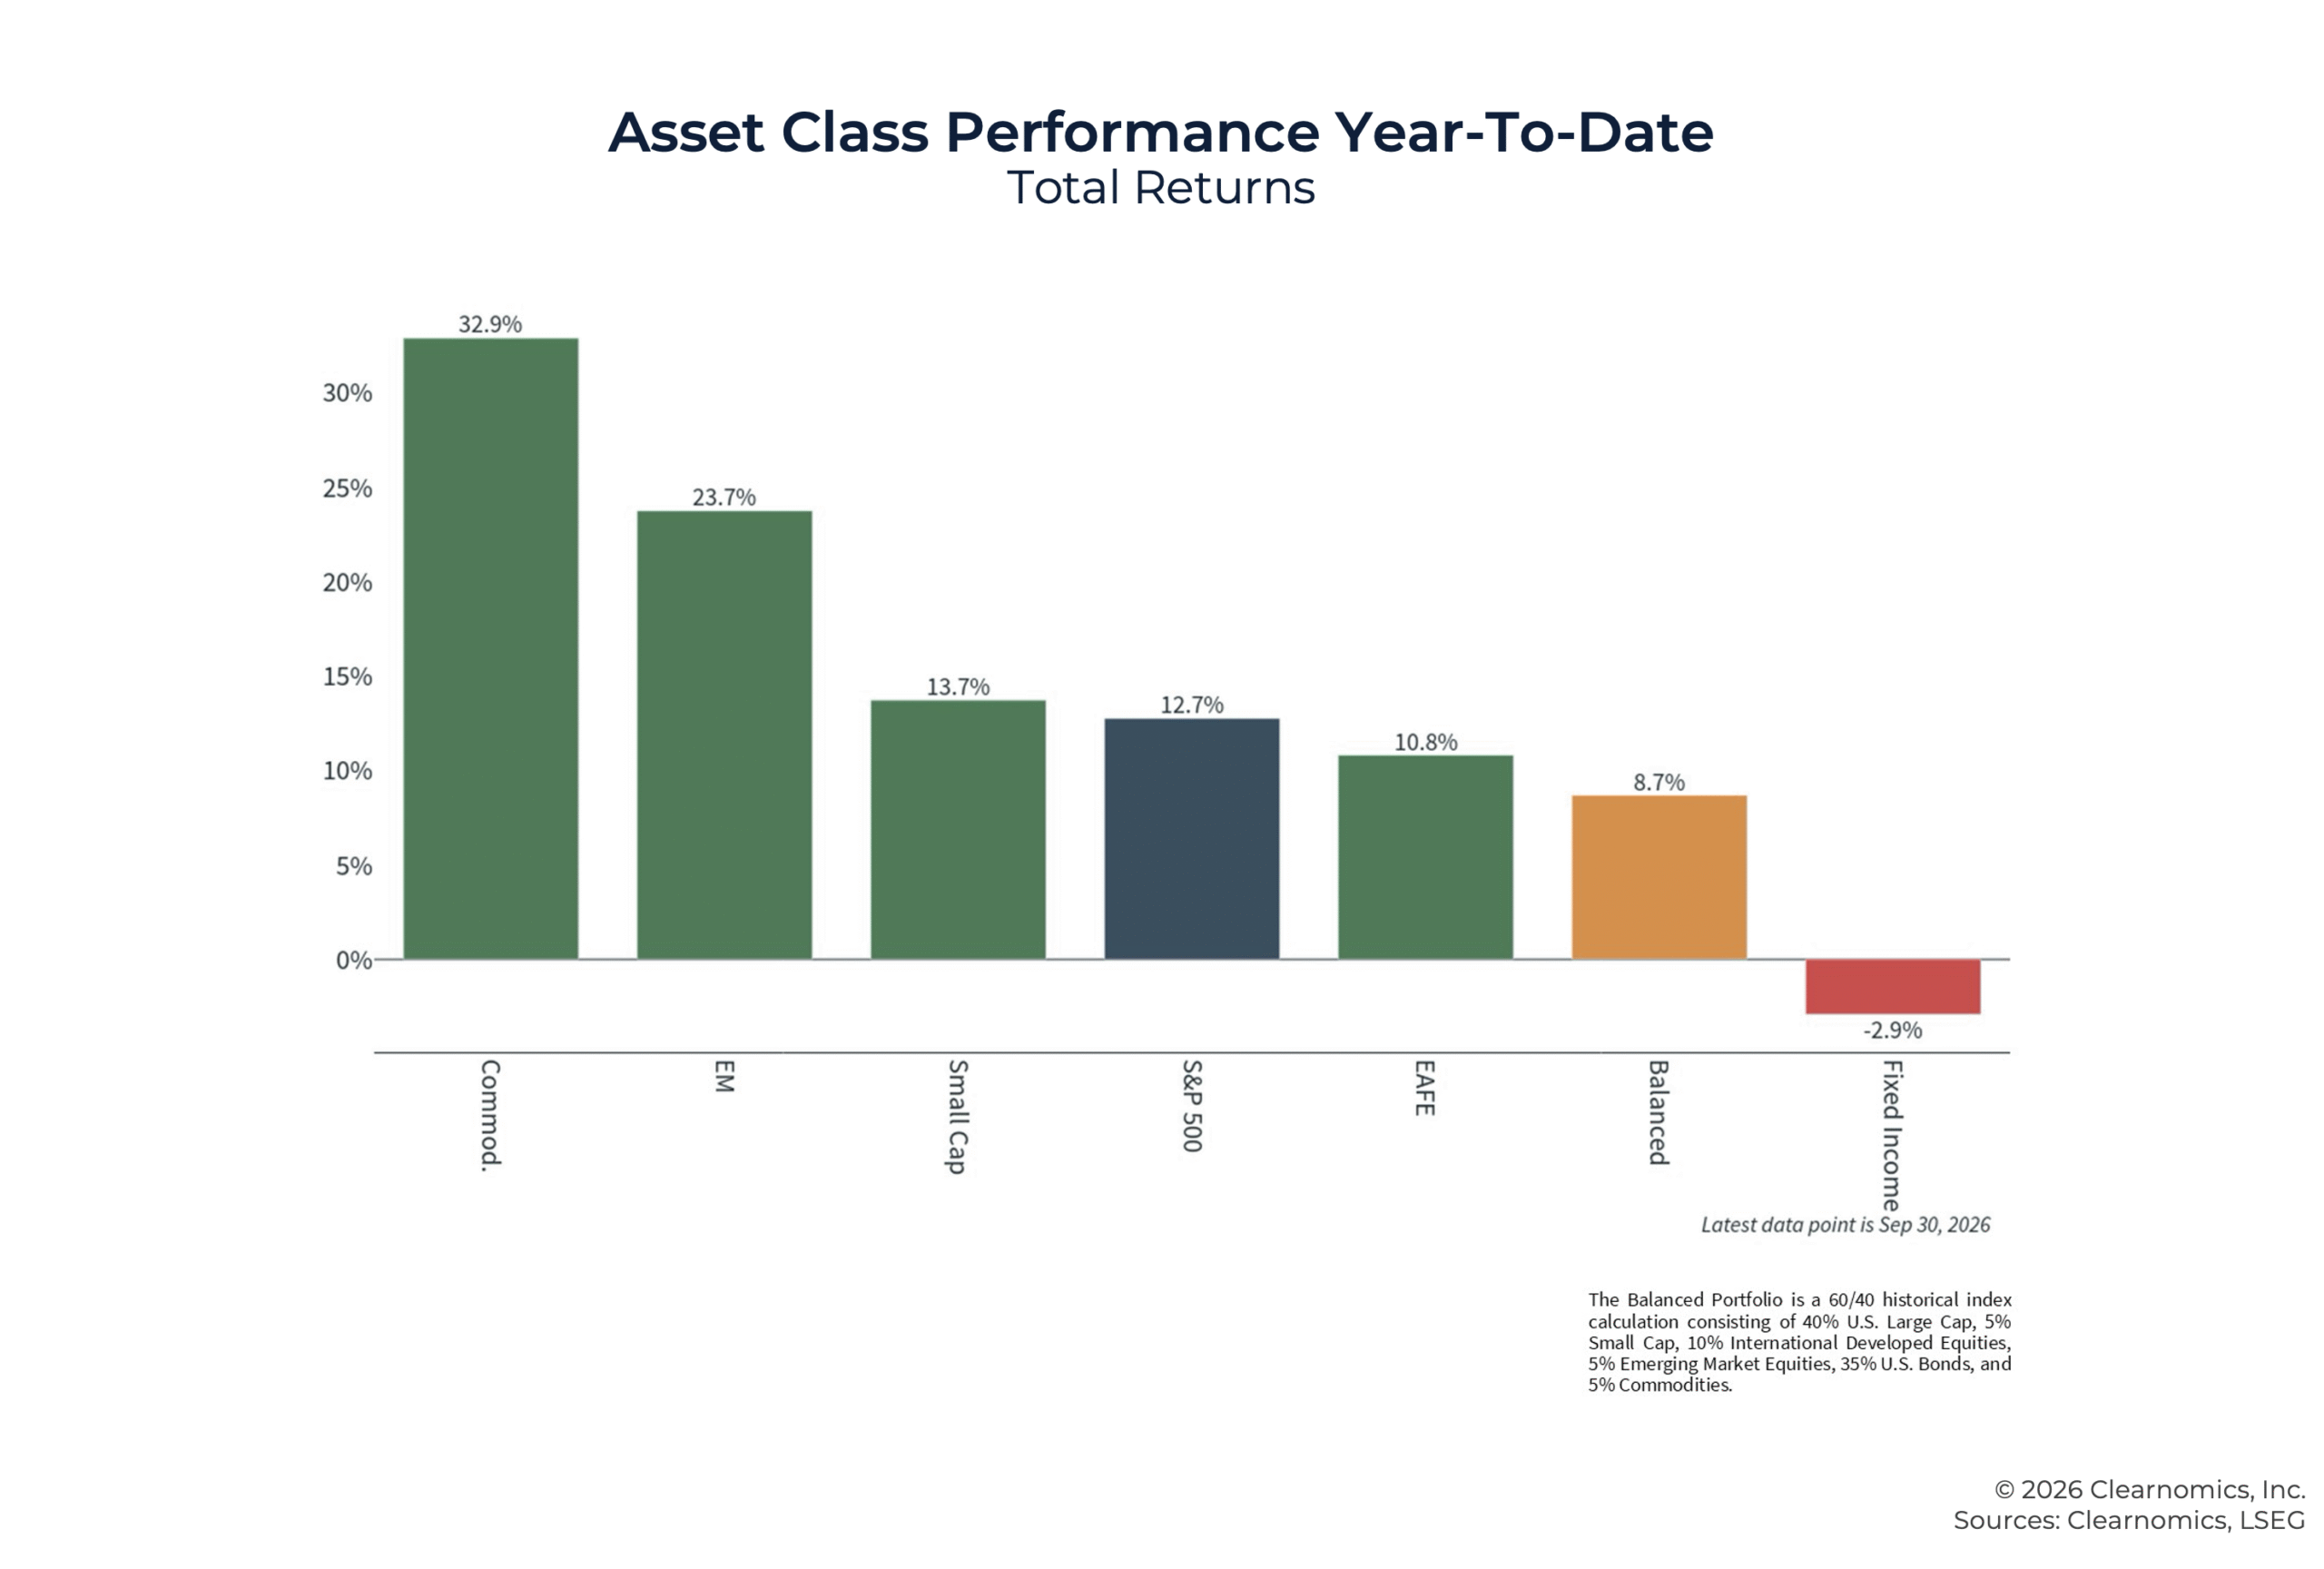
Here are some key data points on asset class performance this year:
- The S&P 500 has reached 27 record closing highs this year, despite ongoing concerns over geopolitics, inflation, and Federal Reserve policy uncertainty.
- International developed market stocks, measured by the MSCI EAFE, are up about 11% year-to-date in U.S. dollar terms. Emerging market stocks, measured by the MSCI EM, are up approximately 24% year-to-date.
- Gold touched an all-time high above $5,000 per ounce at the beginning of the year but pulled back to $4,154 at the end of the third quarter. However, gold is still up nearly 135% from five years ago.
- Energy and Technology have been among the top-performing S&P 500 sectors, with Energy benefiting from higher oil prices and Technology supported by continued AI investment.
Despite many sources of macroeconomic uncertainty, the fact that U.S. stocks, international equities, and commodities are all contributing positively to portfolio returns demonstrates the value of a well-considered asset allocation. This will only grow in importance if the Fed raises rates further, interest rates remain high, oil prices continue to be volatile, and factors such as the upcoming midterm election create new uncertainties.
Providing Clients With Perspective
While many asset classes have performed well this year, markets never move in a straight line – and surely the fourth quarter will bring new concerns. For financial advisors, periods of market volatility represent opportunities to share long-term perspectives that build client trust and help them to stay focused on their long-term goals.
Advisors who would like to use these visuals can download a PDF copy here. The charts can also be customized with firm branding through the free Clearnomics Community insights platform.