
Executive Summary
Most retirement research assumes that retirees spending from a portfolio will seek to maintain a "real" inflation-adjusted standard of living throughout their retirement, just as they implicitly would have if their portfolio had been paid out as a steady pension with an annual cost-of-living adjustment. However, despite the simplicity of this assumption, retirement research has increasingly shown that retirees actually experience a decline in real spending through their retirement, as the early "go-go" years transition to less active "slow-go" years and then finally wind down in a series of "no-go" years with little discretionary spending.
In a new study contributing to the literature on this subject, David Blanchett of Morningstar has issued a new study entitled "Estimating the True Cost of Retirement" that finds in reality, real retiree spending decreases slowly in the early years, more rapidly in the middle years, and then less slowly in the final years, in a path that looks less like a slow and steady decline and more like a "retirement spending smile" instead. Implicit in these results is an acknowledge that, despite the common fears, even the uptick of health care expenses in a retiree's later years are not enough to offset all the other spending decreases that tend to occur as retirees transition into the "no-go" years and other discretionary expenses fall significantly.
The implications of this research are not only that financial planners should be more cognizant to assume some level of real spending decreases throughout retirement (Blanchett's research suggests this may be especially true for more affluent retirees who tend to have more discretionary spending that winds down over time), but also that the traditional research may be somewhat overestimating the amount of funds needed to retire in the first place, as a lower average spending level across all the retirement years means it simply may not take quite as much to retire as is typically assumed or modeled in a typical financial plan!

Spending Trends In Retirement
A classic assumption for most retirement research is that retirees will try to maintain a consistent standard of living, which in economic terms means they will need "real" inflation-adjusted stream of cash flows to support their retirement lifestyles. This research assumption dates back not only to Bill Bengen's safe withdrawal rate "4% rule" studies (which assumed retirees maintain a steady inflation-adjusted standard of living) but arguably originates in the lifetime income stream it is intended to replace. After all, if drawing on a pension with cost-of-living adjustments leads to a steady inflation-adjusted stream of income throughout retirement, shouldn't portfolio-based retirement spending cash flows do the same?
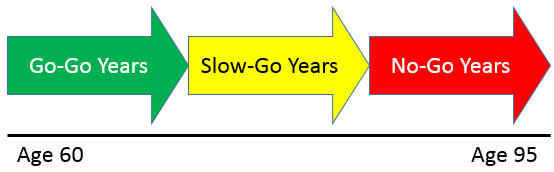
Yet this assumption of steady spending is not necessarily supported by all. Michael Stein, author of "The Prosperous Retirement" first popularized the concept of a three-phase retirement: the Go-Go years, the Slow-Go years, and the No-Go years. The approach was relatively straightforward: early retirement is represented by the "Go-Go" years and is characterized by an active phase, that may include a continuation of a lifestyle similar to pre-retirement, but with more time for spending and "extra" activities like travel; the "Slow-Go" years are when health and energy begin to decline a bit, resulting in some spending reductions as the budget for activities like travel or even just eating out begin to decline; and the "No-Go" years are characterized by an almost total shutdown of activity-related spending, as consumption decreases to just the core expenditures necessary to maintain the household itself.
While this three-phases-of-retirement approach seems a reasonable way to characterize a retiree's discretionary expenditures - with some research to suggest it's an accurate characterization, albeit with some uncertainty about when exactly a retiree will transition from one phase to the next, as it may be contingent on rather abrupt health events, rather than a slow and steady decline - it leaves open one of the key concerns regarding late-retirement spending in particular: expenditures on health care. Even the Bureau of Labor Statistics, which tracks consumer expenditures over time in order to construct the "baskets" used to measure the Consumer Price Index (CPI) itself, has recognized that spending for the elderly looks "different" than for the general public. Thus, for instance, the construction of CPI-E (for elderly) includes a lower weighting to food and beverages and also transportation, and a much higher weighting to medical care, than the 'standard' CPI-U measure.
Which raises the fundamental question: are increases for health care expenditures in the later years more or less than the decreases in other discretionary spending categories are retirees move through the slow-go and into the no-go years? In other words, when the spending categories that increase are matched against the ones that decrease, is the net result that on average retiree spending still rises with the general level of inflation over time, or does it go up even faster (because the health costs overwhelm), or does it actually begin to slowly decrease as more and more discretionary spending ceases as the years go by?
The Retirement Spending Smile
A number of retirement spending studies have attempted to analyze the question of retiree spending behavior throughout retirement, including most notably a study by Ty Bernicke in the Journal of Financial Planning in 2005 entitled "Reality Retirement Planning" which found that in fact, the data from the BLS' Consumer Expenditure Survey suggests that retiree household expenditures do decline slowly but steadily throughout retirement; a similar working paper from the Boston College Center for Retirement Research, also using the BLS' data, found that consumer expenditures experience a real (inflation-adjusted) decline of 1%/year.
In the latest research in this category, a new working paper from Morningstar head of retirement research David Blanchett entitled "Estimating the True Cost of Retirement" similarly found that real retirement spending decreases through much of retirement, but with a notable upturn at the end that makes retirement spending look somewhat like a smile. The data is drawn not from the BLS' Consumer Expenditure Survey, but primarily from the RAND Health and Retirement Study (HRS) data, and unlike the BLS' survey includes some longitudinal data (i.e., follows particular households over time).
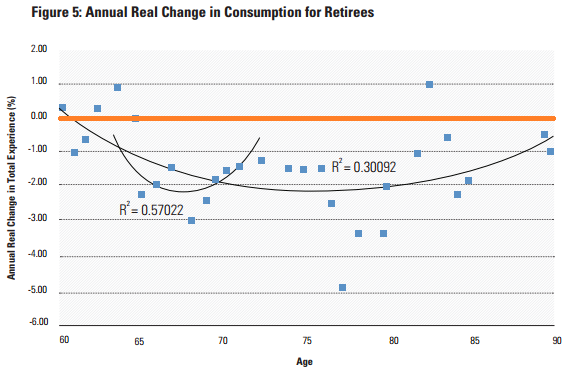
The chart above shows the "retirement spending smile" of Blanchett's research - or what was actually a "mini-smile" from age 65 to 75, and a broader smile that spans all the way from age 60 to age 90, based on the best-fit regression equations that fit the available data (the blue dots). Notably, the horizontal orange line represents the 0% line for real (inflation-adjusted) spending growth; if the assumptions of the safe withdrawal rate research were correct, the blue spending dots (and the associated best-fit regression) should hover around this horizontal line. Instead, the results show not only a "curve" to retirement spending (rather than just a flat or declining line), but the smile also spends virtually all of its time below the 0% line; in other words, the reality seems to be that retirees actually decrease their real retirement spending throughout almost all of their retirement, with annual decreases of 1%/year that accelerate to 2%/year through the "slow-go" years before turning upwards (but not positive!) to 'mere' 1%/year declines again by the end of retirement.
Delving further into the data, Blanchett also examined, from age 65-75 in particular (the data was too limited to cover the whole age 60-90 span), the spending behaviors of four "sets" of households: those who matched their spending reasonably to their household net worth (either by being high-spenders with a high net worth, or low-spenders with a lower net worth), and those whose spending was "mismatched" (either high-spenders with a low net worth, or low-spenders with a higher net worth).
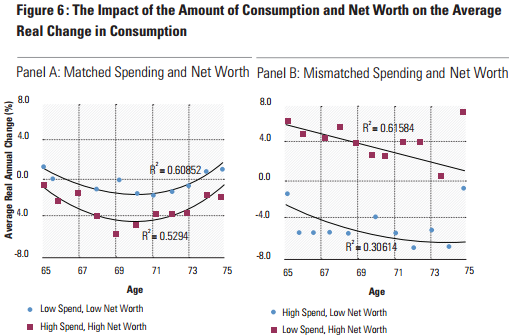
As these results show, the age 65-75 retirement spending smile is clearly evident amongst the households that 'reasonably' match their spending to their net worth. Overall, though, the higher net worth households have a retirement spending smile that sits entirely below the 0% line; in other words, the more affluent retirees (presumably with more discretionary spending) decrease their spending on average throughout this time horizon, just by a more and then less rapid pace (while the lower net worth households, which theoretically have less flexible budgets, finish much closer to where they start). In the case of the mismatched households, a different trend emerges; households spending far beyond their means not surprisingly experience an accelerating pace of spending cuts (their spending changes are below the 0% line and fall further below over time); however, households that spend far less than their net worth would allow experience significant increases in their spending (starting at a real rate of almost 6%/year!) and continue to increase their spending throughout the first 10 years (albeit at a slower pace of increase).
Overall, the results suggest that retiree spending is flexible throughout retirement, especially for higher net worth households (where even with the retirement spending smile, it all sits below the 0% line). Across the full span of retirement, the broader data suggests that the "smile upturn" in a retiree's mid-70s turns downwards again as the retiree moves further into the slow-go years, and to the extent that spending does tick upwards a bit at the end (ostensibly as health care expenses being to have more of an impact), the outcome is still a decrease in retirement spending, merely at a less-dramatic pace of decline. For most of retirement, the only question is whether real retirement spending is decreasing at a pace of 1%/year, or closer to 2%/year instead! (Note: Given an average level of inflation closer to 3% for retirees, these real spending declines would mean that nominal spending still increases throughout retirement, just at a more modest pace as real spending declines are partially offset by positive inflation adjustments in the remaining categories.)
Implications For Retirement Planning Projections
While the Blanchett study adds to a growing base of studies suggesting that retiree expenses do in fact decline through most of retirement (especially for those more affluent retirees with greater discretionary expenses who are more likely to be the clients of financial planners), it is one of the first to delve so carefully into longitudinal data, and to examine the more nuanced counterbalancing effects of what appear to be decreases in discretionary spending offset (but not fully) by increases in health care spending in later years. Unfortunately, the data set was still too limited for the detailed breakout of different matched or mismatched spending styles throughout retirement, but the results nonetheless appear to be quite consistent in showing a steady decrease in spending at some pace throughout retirement; the only question is just how quickly the spending decreases are occurring.
In turn, this study suggests that even clients (or their planners) who fear that health care expenditures may rise in the later retirement years should still be assuming some decrease in retirement spending throughout much of retirement. This is especially true for the subset of retirees (including the clients of most planners) who have full Medicare Part B and Part D coverage, along with a Medigap supplemental policy; while such coverage may cost roughly $5,000/year for a retiree (or about $10,000/year for a married couple), it converts almost all uncertain future medical expenses into a steady premium that will not rise by more than the general level of inflation (and be heavily offset by other retirement spending categories that decline as retirees age). This leaves non-medical long-term care expenses as one of the few remaining wild cards - albeit one that could materially distort the retirement spending smile - but it too is an expense that can be converted from a potentially large unknown contingency into a known insurance cost at what appears to be an increasingly stable premium. While the reality is that many households cannot afford to obtain such 'comprehensive' coverage as full Medicare Parts B and D, a Medigap supplemental policy, and long-term care insurance - and thus may need to set aside some funds for contingencies - the results suggest that for households that can afford to insure, retirement spending should experience a steady real decline throughout most of the retirement years (and by insuring, retirees can better manage that spending pattern without needing a large contingency fund for the final years!).
Unfortunately, the ability to model this in retirement planning software is still limited. No financial planning package (at least that I'm aware of!) is able to fully model Blanchett's "retirement spending smile", though some tools can at least show the impact of an assumed 1%/year annual decrease in real retirement spending. The planner might assume an "extra" downwards bump of another 5%-10% one-time decrease in spending (in addition to -1%/year) in the client's mid-to-late 70s to signify the low point (i.e., the fastest rate of spending declines) in the spending smile. Yet another approach might be to skip the annual decreases, and step retirement spending downwards by decade; for instance, a 5%-10% real cut at age 70, another 10%-20% cut at age 80, and a final 5%-10% cut at age 90 (the greatest cut in the middle again signifying the trough of the retirement spending smile).
Nonetheless, the bottom line of the Blanchett study is that it clearly reinforces that financial planners should be assuming some level of spending cuts for most clients in retirement (unless their net worth and spending is so modest that it's sheerly impossible for any spending declines to occur without curtailing basic subsistence), especially for married couples who would also likely experience additional spending declines in later years when at least one spouse is likely to have passed away. While that doesn't diminish the importance of managing unknown health (and long-term care) concerns, and maintain a contingency for such expenses, the reality appears that for most retirees, the impact of such rising expenses in the final years is still not enough to offset the general level of decline in retirement expenditures that occur as retirees transition from go-go to slow-go and finally to no-go years. And the difference is not trivial, as Blanchett's research suggests that, once these adjustments are taken into account, retirees may need as much as 20% less to retire than what traditional models have assumed!
So what do you think? What are your assumptions for client retirement spending? Do you assume expenditures decrease in the later years? Steadily, or all at once? What are your assumptions about how retirement spending trends for your own clientele and their retirement planning projections?

The spending smile is looking more appealing. The puzzle of spending is a tough one, and the more data available on actual patterns is very valuable. JPM Chase has also reported a pattern quite similar to Blanchett’s (google JP Morgan The lifecycle of spending). Somehow they have extracted the pattern from data from their customers (cardholders, mortgages, …). Interesting and intuitively appealing breakdown by spending categories as well that support the findings.
It would be quite helpful to have estimates at say the 10th, 50th and 90th percentiles for both medical/dental expenses and long-term care expenses. Recently there was mention of the variability of healthcare costs across individuals, pointing out estimates like Fidelity’s annually updated figures (2013 numbers of $220K for lifetime costs) are an estimate of average (median?) that do not include long-term care, over-the-counter meds and other out of pocket expenses. The spread among retirees was quite high. (I can’t lay my hands on the reference now).
And to amplify the spread: personally I like being a card-carrying Medicare participant, but I also carry a checkbook and don’t plan to restrict myself to Medicare-covered services (that’s a pre-ACA attitude). Which reminds us that the “know your client” rule applies here as in all places. The confirmed “over-spender” seems to always find a way, even as they age, as do skilled penny-pinchers. And Carolyn McClanahan’s reference to “Your Medical Mind” may give insight to how to tune individual client estimates for medical and long-term care costs.
Not a complete surprise as we had noticed that following the 4.5% rule the average portfolio didn’t go down, but instead quadrupled over 30 years.
I suspect that retirees are not increasing their spending based on inflation each year. I know my clients taking distributions from non-quallified spending tend to withdraw a steady amount over multiple years increasing distributions only when I encourage it. The RMD situation generally provides a steady increase in distributions over life expectancy so that is self adjusting not based on inflation but based on market returns. So maybe instead of inflating spending in projections we either reduce the inflation factor or eliminate it altogether. Maybe the inflation rate for retirees is lower in general because they adjust their spending based on the measured distributions?
Michael– While you say that “Unfortunately, the ability to model this in retirement planning software is still limited,” I contend that it’s not that difficult to model with a good spreadsheet and separation of expense planning into non-discretionary, discretionary, and medical expenses, with a separate level of assumed inflation applying to each. For instance, in my retirement planning spreadsheet, I have been assuming that long-term non-discretionary expenses inflate at 3.5% (nominal), discretionary at 2.5%, and medical at 6%. (I’m really assuming in the medical inflation number that 5% annual increases reflect the cost of medication and services plus a 1% annual rise to reflect increased utilization of these as I get older; I don’t understand how you can assume that Medicare B+D+Medigap won’t rise more than the general level of inflation…). At any rate, the strategy of separating assumed inflation rates — with discretionary expenses below the general (non-discretionary) level of inflation and medical expenses above it — can approximate the “smile” that you and Blanchett refer to.
Both the smile and the go-go no-go approach are better modeling assumptions than the straightline increase. From my perspective, a key component in spending is also asset performance and income. As income has pervasively declined, I see clients struggling to adjust spending patterns. I believe that clients have a hard time spending based on account gains as they can be viewed as temporary, whereas income has a more permanent spendable feel to it. Given the returns of the market over the last three years, you would expect an increase in confidence/expense tolerance, but the lack of income available seems to overshadow net worth increases. I don’t know what the ratio is but if I had to speculate I would guess that $1 of additional income equals $10 of net worth. We may be spinning our wheels looking for a mathematical solution to a psychological problem.
Over the years I’ve been actually talking with clients about what they think the declines will be. Such as, we will go on less vacations so we can reduce or eliminate those expenses. We might only need one car, we will not go out as much. We will cancel our gym membership, we will most likely transfer the camp to the kids for estate/long term care planning-so those expenses will go away. This article gives a “third party” endorsement to the work I’ve already been doing. I have never seen research like this. This is exactly what I was looking for as I’m hitting some barriers with a client’s retirement income plan. Thanks for posting this. It has been quite helpful.
Gary,
Happy to be of service! I hope it was helpful! 🙂
– Michael
The “Smile” has an R2 of 0.3. Not much in way a correlation there. Those dots are all over the place, but most below the zero line.