
Executive Summary
It is an accepted belief that retail investors, swayed by a barrage of financial news and information, and the wiring in their own brains, tend to systematically buy at market peaks and sell at market lows, resulting in returns that are far lower than what could have been achieved by simply buying and holding.
This so-called "behavior gap" has been quantified most famously over the years by DALBAR, which produces and annually updates a study of the difference between investor (dollar-weighted) returns and index (time-weighted) returns, and currently shows that investors have cost themselves more than 4% per year in returns for the past two decades.
Yet the reality is that DALBAR's methodology confounds the impact of investor behavior, and the simple consequences of return sequences; it's entirely possible that some or all of the low DALBAR investor returns are simply due to the fact that markets rose for the first half of their time sample (the 1990s) and were flat for the second half (the 2000s).
And in fact, that appears to be the case. Once DALBAR updated their projections to compare investor returns to a passive investor who simply invested systematically over the entire time period, the result surprisingly shows that retail investors in the aggregated actually outperformed systematic dollar cost averaging for the past 20 years!
(Editor's Note: This post was written by guest blogger Harry Sit of The Finance Buff, and is an update to his original post on the topic from 2011.)
The Behavior Gap
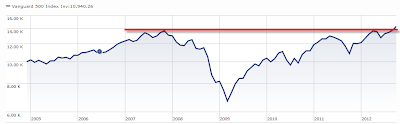
With the recent surge in the stock market, S&P 500 with all dividends reinvested has reached an all-time high.
Numerous articles in the newspaper and on the web typically show retail investors as a whole are "dumb" and imply that they took money out of the stock market near the bottom and are now putting money into the stock market just as it makes new highs.
No doubt such behavior exists. How bad does it hurt the investors' return when they buy high and sell low? The most widely cited study is probably DALBAR's Quantitative Analysis of Investor Behavior. This study compares the investors' returns against market returns. Mutual fund tracking company Morningstar also calculates investor returns for every fund and compares them against the fund returns.
Investor return is a dollar-weighted return (or more generically "money-weighted return"). It takes into account the size and timing of investors' purchases and sales. If investors put a lot of money into a fund and the fund does poorly after that ("buy high"), the investor return will be low relative to the fund's published (time-weighted) return. Similarly, if investors pull a lot of money out of a fund and the fund does well afterwards ("sell low"), investor returns will lag.
The latest DALBAR study shows the investor return in all equity funds in the 20 years ended in 2011 was 3.49% a year while the S&P 500 returned 7.81% a year during the same period. This suggests that the average equity investors' poor market timing cost them 4.32% a year for 20 years - a gap in performance due entirely to their own harmful behaviors.
I've seen this interpretation in many books, including books by respected authors Burton Malkiel, Larry Swedroe and Rick Ferri. While the intention is good -- warn investors against buying high and selling low -- the interpretation is wrong because comparing investor returns against index returns is comparing apples to oranges. The 4% a year number is so incredible that it makes the number not credible. The so called "behavior gap" isn't as high as the DALBAR study says.
Flawed DALBAR Methodology For Measuring The Behavior Gap
The reason the DALBAR study is incorrect is that while "buy high sell low" will make investor returns lower than market returns, it's not the only factor. When using dollar-weighted returns, the pattern of market returns over time also plays a big role. Consequently, when you see the investor return is lower than the market return, you can't necessarily attribute all (or possibly even some) of the difference to "buy high sell low."
Let's look at two hypothetical examples.
Suppose the stock market doubled in year one and then stayed flat for nine years. Over the 10-year period, the market return is 7.2% a year ("rule of 72"). If an investor invested $1,000 every year in an index fund that exactly matched the market, the investor would have $11,000 at the end of 10 years. Only the first $1,000 doubled. The other $9,000 had a zero return. As a result, the investor's dollar-weighted return is only 1.7% a year for 10 years.
The big difference between the market's 7.2% per year return and the investor's 1.7% per year dollar-weighted return isn't caused by any performance chasing or bad market timing. The investor is just faithfully investing in an index fund for the long term. When the market did well in year one, the investor simply didn't have much money invested to catch the good return.
Now suppose the stock market stayed flat for nine years and then doubled in year 10. Over the 10-year period, the market return is still 7.2% a year. If an investor invested $1,000 every year in an index fund that exactly matched the market, this investor would have $20,000 at the end of 10 years, resulting in a dollar-weighted return of 12.3% a year for 10 years. It's higher than the market return because in the year when the market return was high, the investor had $10,000 invested versus only $1,000 invested in the previous example.
Depending whether the market had higher returns in the beginning or in the end, investors are seen either as dumb or smart even when they made no effort to time the market.
That's exactly what happened lately. Morningstar shows some mutual funds have investor returns much higher than the fund returns. Here are some examples:
| Fund | 5-Year Average Fund Return |
5-Year AverageInvestor Return | Investors Outperform |
| Vanguard Target Retirement 2045 (VTIVX) | 1.09% | 4.35% | +3.36% |
| Fidelity Freedom 2045 (FFFGX) | -0.08% | 5.43% | +5.51% |
| T. Rowe Price Retirement 2045 (TRRKX) | 1.52% | 5.53% | +4.01% |
* Source: Morningstar. Data as of Aug. 31, 2012.
Are investors in these target date funds geniuses in timing the market? In addition, are investors in the actively managed Fidelity and T. Rowe Price target date funds smarter than investors in Vanguard funds because they beat the fund returns by a bigger margin? I don't think so. The measured 5-year period starts in 2007, before the crash. When the fund return was bad, investors didn't have much money in these funds. As more money came into the funds, the market had better returns. That's all.
DALBAR Results More Sequence Of Returns Versus Bad Timing
When you see that big positive difference between investor returns and fund returns can be caused by when the market had good returns, you know big negative difference can be an accident of history as well. It just so happens DALBAR's study period begins in 1992 and ends in 2011. The stock market had good returns in the first decade and bad returns in the second decade. No wonder there is a big negative difference.
Because DALBAR sells the study to financial advisors to show how investors do poorly on their own, DALBAR has an incentive to exaggerate the effect of poor investor behavior. The 2012 edition of the study also includes some contrived arguments against the fiduciary standard. It's off topic for this post but it also reflects where DALBAR's allegiance is.
To its credit, the latest DALBAR study also shows investor returns of a dollar cost averaging investor. If an investor invested a fixed amount in equity funds every year, the investor return would have been 3.17% a year for 20 years, compared to the actual investor return of 3.49% a year. The average investor beat dollar cost averaging! Why isn't that the headline?
Reference:
- DALBAR: Quantitative Analysis of Investor Behavior, Advisor "Free Look" Edition, 2012
- Russel Kinnel, Morningstar: Bad Timing Eats Away at Investor Returns
- Morningstar: Investor Returns Fact Sheet

Really good explanation. I’ve known there has been a problem with the Dalbar results but never saw it presented like this. I would like to see Dalbar’s response.
Probably like most advisors I see a few people bail at market extremes but most do nothing. Some are forced to get out at the bottom because of job issues etc. Emotions play a role but it seems they may have been over emphasized.
Michael,
Clearly there are issues comparing DW and TW returns in studies like these. Couldn’t much of your question be answered by examining the total fund assets at each interval? I’m sure that fund assets have grown over the time period studied, but can the study be controlled for that? I would also note that DALBAR has conducted this study for many years (and thus several rolling periods) and the results have held.
Regards,
James Osborne
James,
Given the sequencing issue, where returns were great in the 1990s, peaked in 2000, and declining ever since, adding more time to the end of the study means little – every year they continue to add since 2000, where the market has not made material new highs, will simply reinforce the time-weighted versus dollar-weighted gap that’s already there.
And notably, DALBAR to my knowledge has not looked at DIFFERENT rolling time periods. They keep taking the SAME time period and just adding bad years onto the end (given mediocre cumulative returns since 2000), which just builds on and exacerbates the issue.
– Michael
Michael,
I think you are mistaken about the time periods – I believe each study has always been a 20-year rolling period, so the earliest studies would have significantly different time periods than the most recent. So we aren’t talking about adding time to the end of the study, but moving the 1990’s closer to the middle of the study. Can anyone find out who is right on this one?
James, I think you are correct. I have a 2007 QAIB study from Dalbar (oldest I could quickly find) as well as the 2008 version, and both cover prior 20-year periods (2007: 1987 to 2006, and 2008: 1988 to 2007).
Very interesting post Michael. You make a number of good points. I’ve had a keen interest in the DALBAR reports for more than a decade. I hadn’t thought of the return path before as a significant factor – but clearly it is.
About 18 months ago, I wrote a blog post on this topic and I highlighted what I think is an even more basic methodological weakness of the historical DALBAR studies. I tried contacting DALBAR a couple of times to get their input but received no response.
My post is linked below. I’d be interested in knowing if the methodology description is very different in the current report as in the older report cited in my article.
http://thewealthsteward.com/2011/04/does-dalbar-really-calculate-investor-returns/
I linked to the latest DALBAR report at the end of the post. See if you can understand what exactly they are doing. I couldn’t.
My best interpretation is that they are calculating dollar-weighted returns only on the flows, ignoring the beginning balance. In other words, if I start out with $1 million, add or take out $1k, $2k here and there along the way, my DALBAR return is calculated only based on my $1k and $2k trades. I could screw up my $1k and $2k timing really badly but my overall return isn’t that bad because it’s predominately determined by the $1 million that doesn’t move.
Agree that the methodology must be wrong. The 2011 performance for equities could only be explained if they are including foreign equity funds, which did much worse than the U.S.
The fixed income returns, however, are inexplicable both for one-year and longer horizons. Those numbers make no sense at all.
So it seems that not only is DALBAR not comparing apples to apples (i.e., time-weighted vs. dollar-weighted), they aren’t calculating anything meaningful at all! It appears to be some bastardized version of dollar-weighted, but actually has no informational content.
I didn’t realize until after I posted my above comment that you were the other of this post and the one I referenced in my April 2011 blog post on the same topic. Unlike what you’ll find in academic papers, DALBAR’s methodological explanations are opaque.
What you say may be correct because the gaps shouldn’t be so wide as time goes on and assets grow and net flows shrink as a % of assets.
But looking at this again it appears as if DALBAR is lumping an awful lot into this ‘gap’. Their description today sounds more like they are calculating investor returns in funds. But they are not comparing against the potential returns on the same funds (via buy and hold or DCA).
They appear to be comparing investor returns in funds vs. benchmark returns for U.S. stocks and bonds. And that gap includes things like fund expense ratios and manager value added/detracted. It also includes performance differences attributable to any investing outside of the benchmark that funds do. In other words, lots of noise that has nothing to do with investor behaviour.
I spotted this problem with DALBAR’s research many years ago. The day will come that the return series “flip” due to a long period of strong market performance, but that could still be many years away.
As a test, if you know anyone at DALBAR, ask them if they can provide their return data for just the 1990’s. Given the significant growth in mutual fund investing and hearty returns at the end of the cycle, I would expect to see the dollar-weighted investor returns exceed the indexed time-weighted returns.
Thank you TFB for the analysis. It is pretty damning. The next logical step would be to discuss how to shield the retail investor from the vagary of lumpy returns aka risk from sequence of returns. As we know this risk increases as the investor nears retirement. No other option than to get an annuity? I am really out of depth here and would like the communities input and wisdom. Thanks!
“As we know this risk increases as the investor nears retirement.” I’m not sure I follow that. As I understand it, prior to taking distributions, sequence of returns doesn’t matter (thanks to the commutative law). The reason it *seems* that the sequence matters when one gets near retirement is that expectations change and it’s hard not to look at the high water mark when calculating what one will be able to withdraw. So someone who has a good first nine years followed by one bad one just before retirement will of course be disappointed, but they will have the same assets at the end of those ten years as someone who had that bad year first followed by the nine good years. If that’s wrong, please explain. Thanks!
I’ve been an Advisor for a long time. I have never come across a 3 year only, or 5 year only MF investor unless they’ve taken such a beating that they’ve given up on the market all together. To criticize the report for focusing on rolling 20yr data is absurd. The notion that a MF investor had a great run and then walked away is ludicrous.
Scott,
I’m not sure I follow your point.
The problem is not that it’s a rolling 20-year period, per se.
It’s that the implied “behavior gap” is largely an artifact of what happens using the DALBAR methodology over a 20-year period when dollars from into markets over time.
The fundamental point is that, even with DALBAR’s own data on rolling 20-year periods, THERE IS NO BEHAVIOR GAP if we merely assume investors dollar-cost-average over time! No one said the MF investor had a great run and then walked away; in fact, the problem is the opposite, that DALBAR’s methodology is distorted by the buy-and-hold investor compared to the (arguably more realistic) systematic dollar-cost-averaging investor who saves whatever he/she can year by year over time.
Respectfully,
– Michael
I’m not sure what the concerns are here. Do we really believe that the reason investor returns look so poor relative to raw performance is because everyone is dollar cost averaging? Doesn’t cash flow data make it rather clear that investors pile into investments and markets after they have risen and exit en masse after they fall rather than making measured investments over time? Dollar cost averaging is always a loser over time because it makes a mindless decision to buy regardless of whether it is 2007 or 2009. Certainly saying that the entirety of the ‘behavior gap’ is the result of poor investor choice is overstating the case, but saying that it could all be a result sequence and dollar cost averaging is probably overstating in the other direction, yeah? Both extremes make rather grand assumptions about investor behavior. The former, however, does have flow data to back it up. Isn’t a well diversified investment strategy superior since it will either not buy or significantly under-buys an asset after it has run up? Doesn’t that explain why more balanced investments, like those noted, will show a better investor return, simply because the fund uses a disciplined strategy and will buy undervalued assets with new cash flows, rather than dumping them into the top of a market? Certainly there are those who have over-used the results of this study for their own ends, much like the Brinson study, but that doesn’t mean it is not identifying some meaningful issues.
Robert,
You’re missing the point here. The point is not that investors are dollar cost averaging. The point is actually that investors ARE DOING BETTER THAN DOLLAR COST AVERAGING, according to DALBAR’s own data!
The “behavior gap” that DALBAR measures is relative to a baseline that assumes the investor put in 100% of their money 20 years ago, and never added a dime to their savings since then. Which we know is factually untrue in the aggregate, because savings/assets in mutual funds HAVE increased, if only because a large chunk of the population continues to work and save in the aggregate.
This is the whole reason why DALBAR’s math is so horrifically flawed. It measures “performance” of the whole population, but fails to take into account normal savings from the population. When you account for the fact that the whole population IS saving in the aggregate, the behavior gap disappears and investors BEAT dollar cost averaging.
Obviously, within that population, there will be many who do far worse (offset by those who do far better), but that’s what makes a market. But investors IN THE AGGREGATE are not doing worse. In point of fact, they “can’t” or there would be a giant amount of alpha on the table for someone else to earn by taking the other side of their trades…
– Michael
The evidence suggest that investors do NOT just dollar cost average over time – in fact the data finds that investors abandon dollar cost averaging when they should do so – during volatile markets. Respectfully, the REAL moral of this post is that the average investor would be better off dollar cost averaging instead of their current herding behavior. http://www.louisllanes.com
Louis,
You’re missing the point here.
What the data shows is that investors actually would NOT be better off than dollar cost averaging. In fact, investors actually “time” in a manner that’s already SUPERIOR to dollar cost averaging. That’s the whole point. Investor timing in the aggregate is not NEARLY as bad as we make it out to be, and the “baseline” that DALBAR measures against to determine this is even more unrealistic (they assume you put in 100% of your money 20 years ago and never added a dime since!
– Michael
@Michael_Kitces:disqus @louisllanes:disqus .
As someone that believes the value in what “real” financial advisors provide is behavior management, I think both of you have just identified the change necessary in the industry. In that, the more we slice and dice the data to show what we want to depict (e.g. Dalbar study, etc.), the more we look less like professionals (to outsiders). To me this stems from the competitive nature of asset-gathering we have been brainwashed to adopt (a whole other tangent–LOL).
The gap the industry needs to fill/close currently is the perception of most individuals that we should be hired to “beat the market” when we should really be hired to manage their behavior so they can “win” with their money. Sadly, when most people experience financial complexity in their lives they turn to themselves rather than a professional (juxtapose to medical complexity or legal complexity).
For what it is worth, I find the study interesting in uncovering cognitive biases that make for interesting discussion topics in client meetings.
BTW–Keep up the good work Michael! This forum is one way we make the profession better!
Hey Michael. Like you I’ve been aware of the flaws in Dalbar’s methodology for a long time. The Finance Buff’s note is a clear one. It really is a basic mathematical error to compare ‘time’ (a.k.a geometric mean) and money weighted (IRR) returns and yet so many (many highly acclaimed) advisers still do this both here (in the UK) and over there. I guess they like the ‘story’ eh? For me the facts are what matters – and I’m grateful to you for your work on this and other matters. http://www.paulclaireaux.com